Animated Business Dashboard UI with Data Charts and Financial Indicators
By DC_StudioOne great value subscription from $16.50/month
- Unlimited downloads of 27+ million creative assets
- AI Tools: video, image and more
- Lifetime commercial license
- Easy cancellation
Already have an account? Sign in
Attributes
- Length
- 0:30
- Resolution
- 3840 x 2160
- File Size
- 2.35 GB
- Frame Rate
- 30 fps
- Alpha Channel
- No
- Looped
- No
- Video Encoding
- ProRes
- Orientation
- Horizontal
- Commercial License
- Further Information
Description
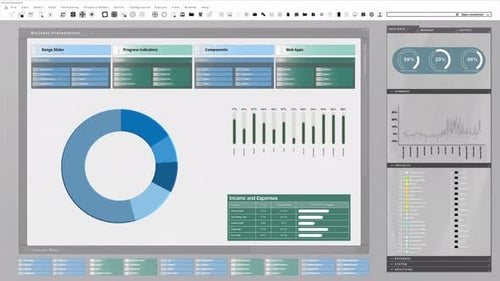
This animated UI template presents a dynamic business dashboard, perfect for corporate presentations and financial reports. It features a responsive design with a prominent donut chart illustrating profit distribution and sales percentages, accompanied by animating bar graphs representing various progress indicators. Additional UI elements include interactive range sliders, component lists, and an income and expenses table that fluidly updates. The modern aesthetic and clear data visualization make this asset ideal for conveying complex information effectively in a professional setting. The clean lines and precise animation enhance any project requiring sophisticated data display.