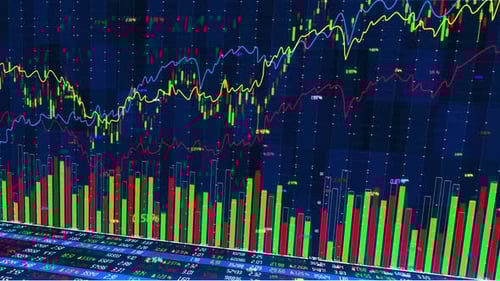
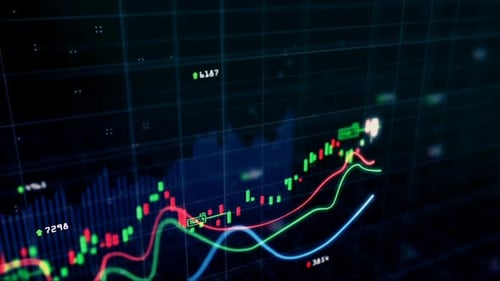
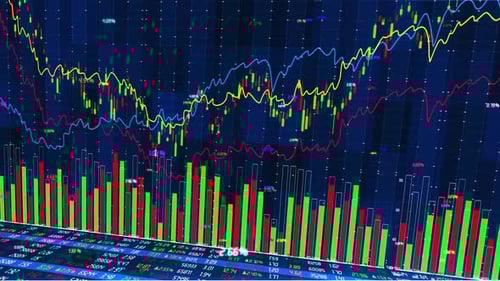
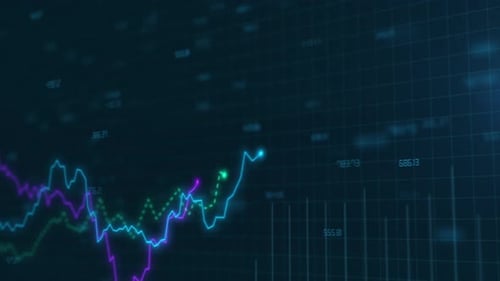
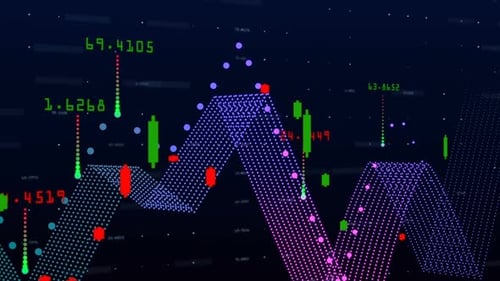
Dynamic Digital Stock Market Chart with Candlesticks and Data Fluctuations
By toxawwwOne great value subscription from $16.50/month
- Unlimited downloads of 27+ million creative assets
- AI Tools: video, image and more
- Lifetime commercial license
- Easy cancellation
Already have an account? Sign in
Attributes
- Length
- 0:10
- Resolution
- 1920 x 1080
- File Size
- 14 MB
- Frame Rate
- 29.97 fps
- Alpha Channel
- No
- Looped
- No
- Video Encoding
- H.264
- Orientation
- Horizontal
- Commercial License
- Further Information
Description
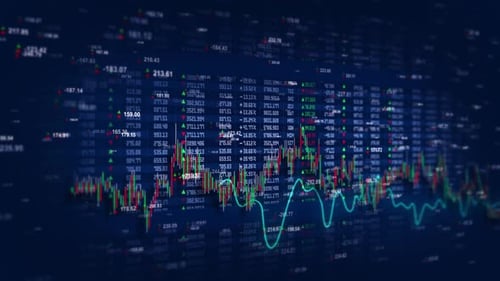
This animated clip vividly displays a dynamic stock market chart, showcasing real-time financial data with fluctuating numbers and intricate candlestick patterns. Vibrant blue and pink line graphs move across a dark digital grid, indicating market trends and trading activity. Red and green candlesticks continuously update, visualizing price movements and investor sentiment. This modern visual effect is ideal for corporate presentations, financial news broadcasts, or any project requiring a sophisticated representation of economic data, business analytics, or global market fluctuations, providing an engaging backdrop to convey growth or decline.