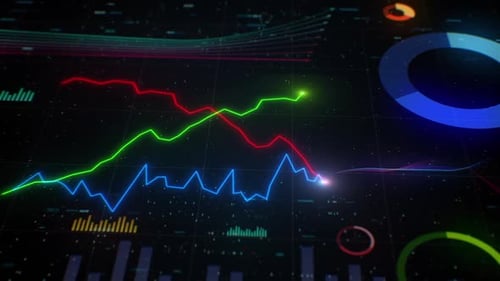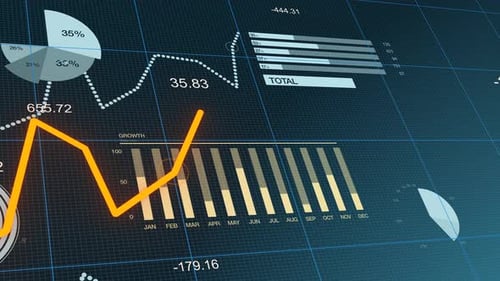
Animated Digital Line Graph of Financial Business Data
By dabartiOne great value subscription from $16.50/month
- Unlimited downloads of 27+ million creative assets
- AI Tools: video, image and more
- Lifetime commercial license
- Easy cancellation
Already have an account? Sign in
Attributes
- Length
- 0:14
- Resolution
- 1920 x 1080
- File Size
- 154 MB
- Frame Rate
- 25 fps
- Alpha Channel
- No
- Looped
- No
- Video Encoding
- Photo JPEG
- Orientation
- Horizontal
- Commercial License
- Further Information
Description
This animated digital line graph visualizes dynamic financial and business data with three fluctuating lines representing different metrics against a subtle grid background. Each line features active data points and constantly changing numerical values, creating a responsive and engaging display of economic trends. The clean, modern aesthetic with green and blue hues provides a sophisticated backdrop suitable for corporate presentations, financial reports, technology-focused content, and data analysis infographics, enhancing any project with its professional and futuristic feel.