One great value subscription from $16.50/month
- Unlimited downloads of 27+ million creative assets
- AI Tools: video, image and more
- Lifetime commercial license
- Easy cancellation
Already have an account? Sign in
Attributes
- File Types
- MTL, GLB, OBJ, BLEND
- File Size
- 15.6 MB
- Textures Included
- No
- Rigged
- No
- Animated
- No
- Polycount
- 62.3K polygons
- Commercial License
- Further Information
- Part of Pack
- Chart Diagrams V1 3D Icon Pack
(10 items)
Description
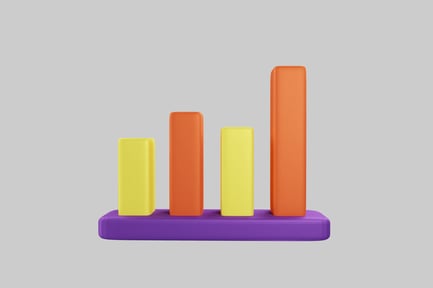
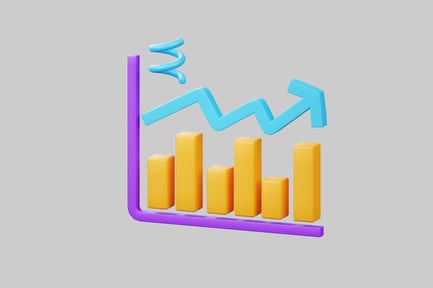
The illustration depicts a bar graph composed of three vertical bars one orange, one yellow, and one purple hexagonal prism containing a smaller yellow cube. Two purple speech bubbles, marked with white text, appear above the bars. Three upward-pointing arrows, two orange and one yellow, are positioned near the bars. A small orange circular disc sits atop the orange bar. The graph elements suggest a visual representation of data analysis and growth.