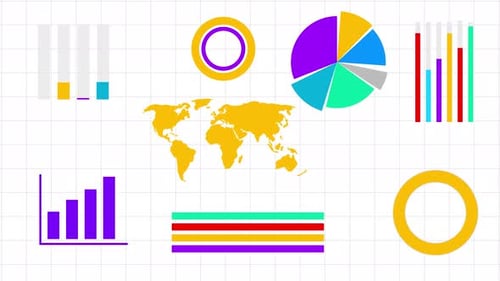
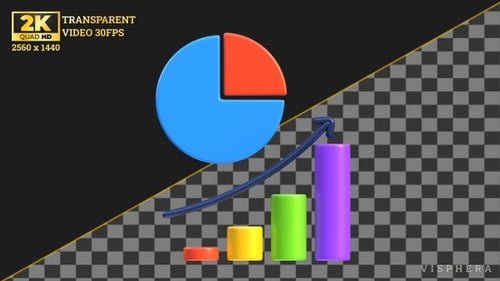
Animated 3D Business Data Charts with Pie and Bar Graphs
By SpectralOne great value subscription from $16.50/month
- Unlimited downloads of 27+ million creative assets
- AI Tools: video, image and more
- Lifetime commercial license
- Easy cancellation
Already have an account? Sign in
Attributes
- Length
- 0:13
- Resolution
- 4096 x 2304
- File Size
- 843 MB
- Frame Rate
- 30 fps
- Alpha Channel
- No
- Looped
- No
- Video Encoding
- ProRes
- Orientation
- Horizontal
- Commercial License
- Further Information
Description
This animated visual presents a dynamic display of 3D data visualizations on a grid paper background. The animation features two pie charts and a horizontal bar chart that incrementally fill and expand with vibrant, contrasting colors. A separate vertical bar graph also builds upwards, and a directional arrow animates, indicating trends or progression. The clean, modern aesthetic and smooth motion make this graphic ideal for corporate presentations, financial reports, or educational content requiring clear and engaging data representation. It provides a professional and visually appealing way to illustrate statistical information and business analytics, enhancing any project with its crisp, 3D rendered elements.