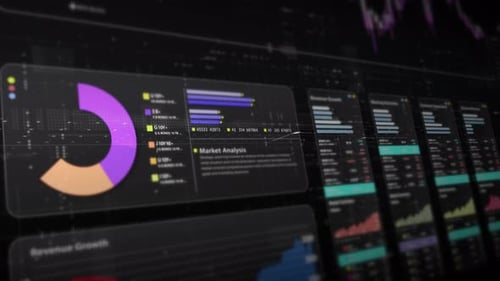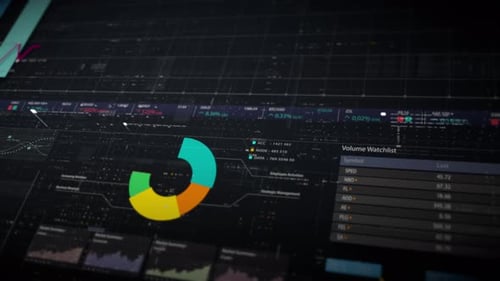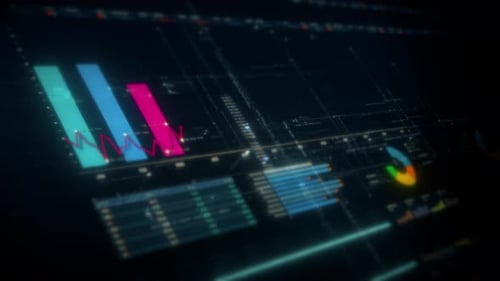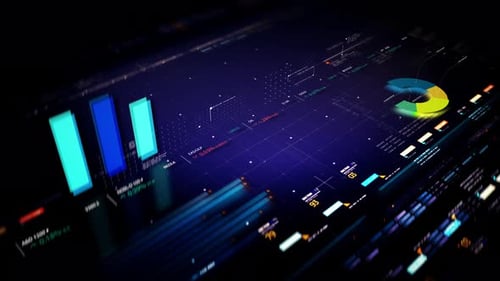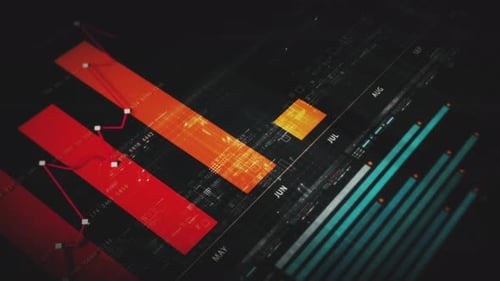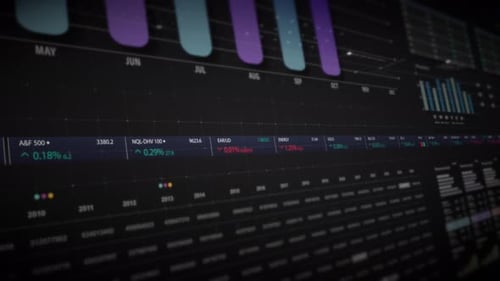
Futuristic Business Data Interface with Animated Graphs
By ColormotionsOne great value subscription from $16.50/month
- Unlimited downloads of 27+ million creative assets
- AI Tools: video, image and more
- Lifetime commercial license
- Easy cancellation
Already have an account? Sign in
Attributes
- Length
- 0:10
- Resolution
- 3840 x 2160
- File Size
- 1.16 GB
- Frame Rate
- 30 fps
- Alpha Channel
- No
- Looped
- No
- Video Encoding
- ProRes
- Orientation
- Horizontal
- Commercial License
- Further Information
Description
This animated clip presents a sophisticated digital interface displaying dynamic business and financial data. A pie chart seamlessly animates its segments, while bar charts extend to visualize metrics, and a vibrant line graph evolves to show trends. The background features intricate glowing grids and data streams, creating a high-tech, abstract environment. This visual effect enhances corporate presentations, technology demonstrations, and financial reports, providing an engaging and professional way to illustrate complex analytics and statistical information with a modern, innovative edge.