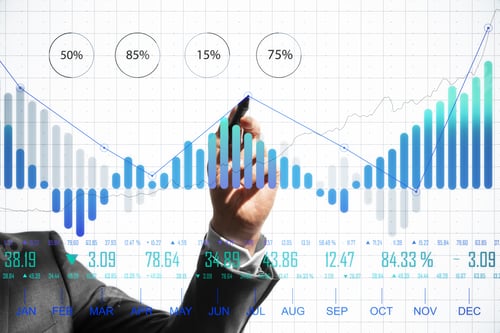
Business professional analyzing financial charts for data insights
By GoldenDayzOne great value subscription from $16.50/month
- Unlimited downloads of 27+ million creative assets
- AI Tools: video, image and more
- Lifetime commercial license
- Easy cancellation
Already have an account? Sign in
Attributes
Description
The photo shows a hand and part of a suit-clad person interacting with a series of financial charts and data. The charts display a variety of information, including stock prices, percentage changes, and different types of graphical representations, such as bar graphs and line graphs. The overall tone is professional and analytical, suggesting themes of finance, investment, and data analysis. The image would be suitable for articles on stock trading or presentations on financial data insights.