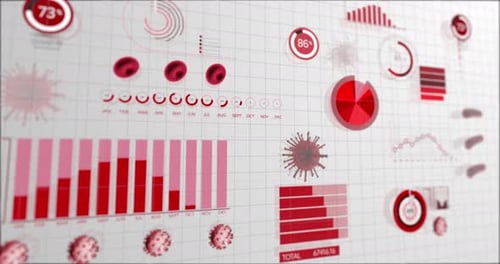
Digital Medical Data Bar Graph Animation with Viruses and Blood Cells
By vectorfusionartOne great value subscription from $16.50/month
- Unlimited downloads of 27+ million creative assets
- AI Tools: video, image and more
- Lifetime commercial license
- Easy cancellation
Already have an account? Sign in
Attributes
- Length
- 0:10
- Resolution
- 4096 x 2160
- File Size
- 916 MB
- Frame Rate
- 24 fps
- Alpha Channel
- No
- Looped
- No
- Video Encoding
- ProRes
- Orientation
- Horizontal
- Commercial License
- Further Information
Description
This digital motion graphic displays a dynamic bar graph illustrating fluctuating data trends. Red and pink bars animate to fill and decrease, accompanied by a dotted line with an arrow that clearly indicates rising and falling values. The futuristic display features abstract circular data points and pulsing UI elements, creating a sophisticated data visualization. Floating in the background are stylized microscopic organisms, including viruses and blood cells, adding a scientific and medical context. This animation is ideal for presentations, reports, or scientific content requiring an advanced, engaging representation of complex data and biological information.