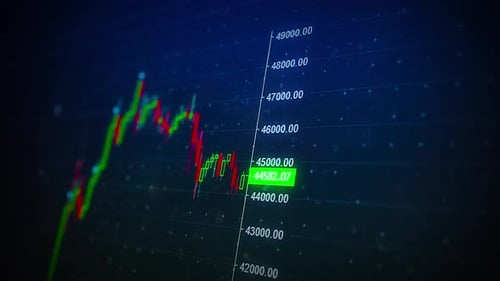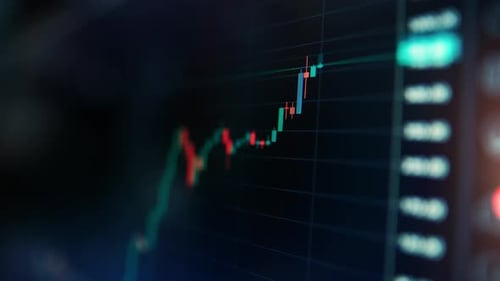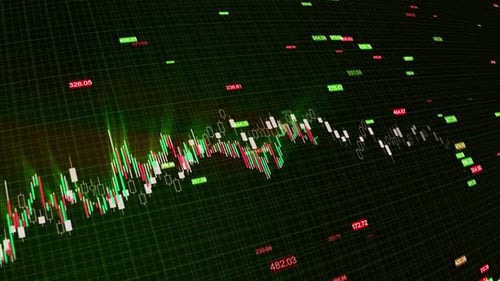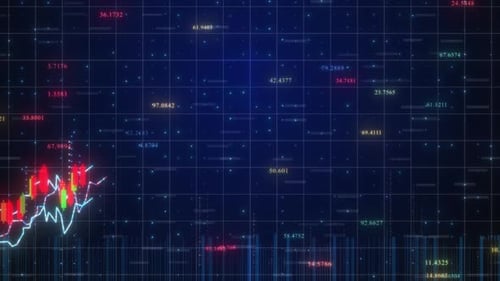
Cryptocurrency chart in real time. The rise and fall of btc on candlestick charts
By MnacikOne great value subscription from $16.50/month
- Unlimited downloads of 27+ million creative assets
- AI Tools: video, image and more
- Lifetime commercial license
- Easy cancellation
- Length
- 0:51
- Resolution
- 3840 x 2160
- File Size
- 1.44 GB
- Frame Rate
- 25 fps
- Alpha Channel
- No
- Looped
- No
- Video Encoding
- ProRes
- Orientation
- Horizontal
- Commercial License
- Further Information
Description
This compelling animated clip offers a sophisticated visualization of complex financial market data, featuring a dynamic candlestick chart alongside animated line graphs and continuously updating numerical values. Rendered against a subtle, gridded background, the animation progresses smoothly from right to left, effectively simulating real-time market activity and unveiling evolving data trends. The clear and precise representation of stock prices, trading volumes, and historical fluctuations makes this visual effect an exceptional tool for enhancing high-stakes presentations, detailed financial reports, or in-depth educational materials. It is particularly well-suited for content related to global economics, cryptocurrency trading, or advanced business analytics. The modern, geometric style of this animation ensures a polished and engaging display of intricate data, providing a compelling and informative backdrop for discussions on market fluctuations, investment strategies, economic forecasts, and financial performance. This digital visualization powerfully conveys market dynamics in a clear, professional, and easily digestible format.