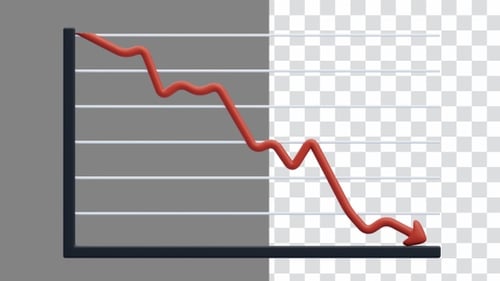
Red Downward Arrow Financial Graph Animation in Flat Design Style
By pixorneostudiosOne great value subscription from $16.50/month
- Unlimited downloads of 27+ million creative assets
- AI Tools: video, image and more
- Lifetime commercial license
- Easy cancellation
Already have an account? Sign in
Attributes
- Length
- 0:08
- Resolution
- 1440 x 2560
- File Size
- 192 MB
- Frame Rate
- 30 fps
- Alpha Channel
- Yes
- Looped
- No
- Video Encoding
- ProRes
- Orientation
- Vertical
- Commercial License
- Further Information
Description
This professional animated graphic features a vibrant red line graph that systematically draws itself across the screen, following a volatile path that ultimately trends sharply downward. The animation concludes with a prominent arrow pointing toward the bottom right corner, serving as a clear visual metaphor for financial decline, economic downturn, or negative business performance. Rendered in a crisp, minimalist flat design style, the element stands out against the high-contrast black background, allowing for effortless integration into various video projects. The motion is steady and deliberate, effectively capturing the feeling of a stock market crash or a failing corporate metric. This visual tool is exceptionally useful for content creators working on financial news broadcasts, investment analysis videos, or corporate annual reports where data visualization is key. Its simplicity ensures that the viewer's focus remains on the message of loss or regression without unnecessary distraction. The clean vector-like appearance makes it suitable for high-resolution productions, providing a polished look that elevates the production value of informational segments. Whether used to illustrate a specific statistical point or to set the tone for a discussion on economic challenges, this animated chart offers a direct and impactful way to convey complex data trends through simplified motion.