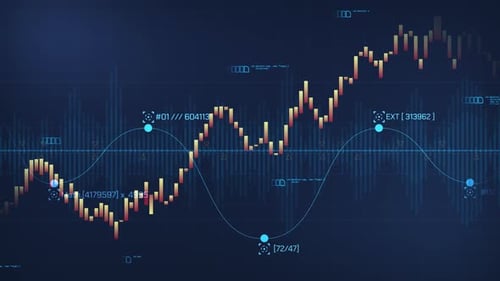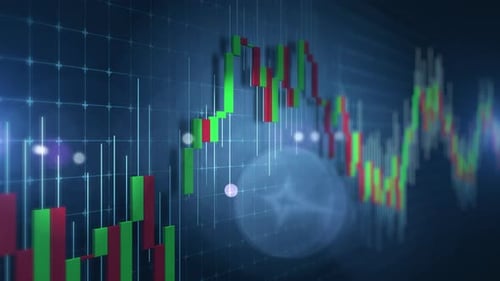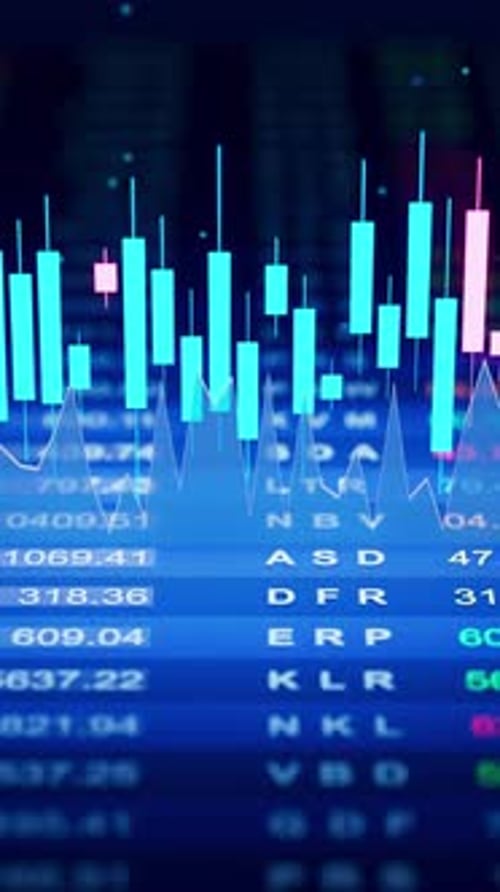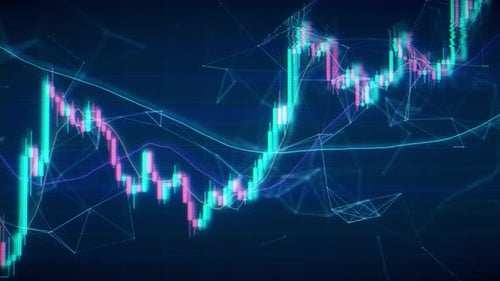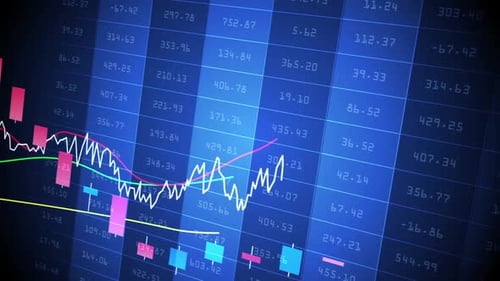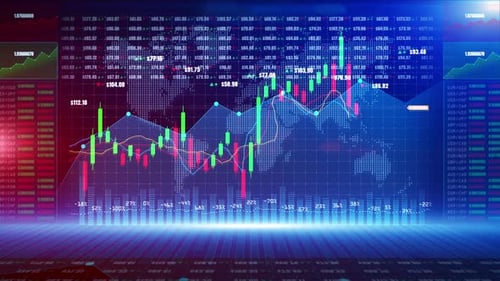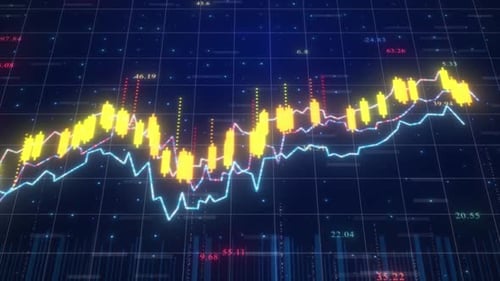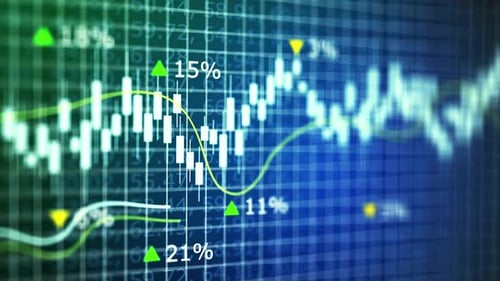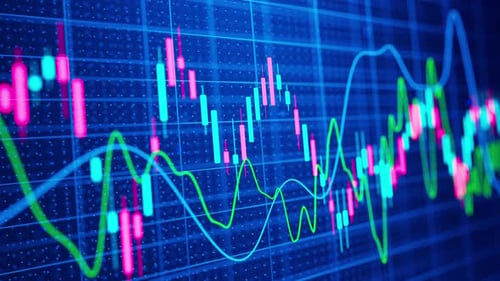
Digital Candlestick Chart Showing Financial Market Data Volatility
By ConceptCafeOne great value subscription from $16.50/month
- Unlimited downloads of 27+ million creative assets
- AI Tools: video, image and more
- Lifetime commercial license
- Easy cancellation
Already have an account? Sign in
Attributes
- Length
- 0:20
- Resolution
- 3840 x 2160
- File Size
- 622 MB
- Frame Rate
- 25 fps
- Alpha Channel
- No
- Looped
- No
- Video Encoding
- ProRes
- Orientation
- Horizontal
- Commercial License
- Further Information
Description
This dynamic motion graphic features glowing blue particles that coalesce and dissipate to form a financial candlestick chart, set against a subtle, animated line graph background. The high-tech, digital aesthetic creates a visually engaging representation of data flow and market trends. Ideal for enhancing corporate presentations, financial reports, technology-focused explainers, or any project requiring an abstract yet precise visualization of complex information. The fluid particle movement and bright, ethereal glow add a sophisticated and modern touch to digital content.