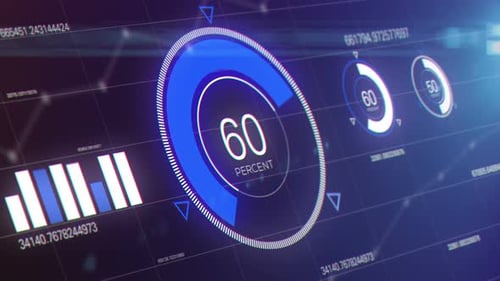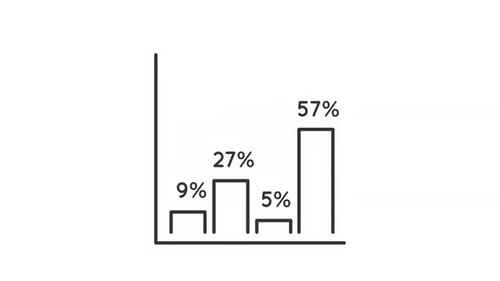
Economy Chart Bar Graph
By keleshOne great value subscription from $16.50/month
- Unlimited downloads of 27+ million creative assets
- AI Tools: video, image and more
- Lifetime commercial license
- Easy cancellation
Already have an account? Sign in
Attributes
- Length
- 0:18
- Resolution
- 3840 x 2160
- File Size
- 168 MB
- Frame Rate
- 25 fps
- Alpha Channel
- No
- Looped
- No
- Video Encoding
- Photo JPEG
- Orientation
- Horizontal
- Commercial License
- Further Information
Description
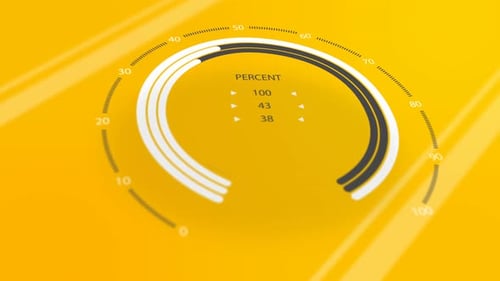
This animated visual features a circular data infographic with multiple progress bars. Each bar dynamically fills to represent a percentage value, accompanied by numeric readouts in the center. The design is clean, modern, and geometric, utilizing concentric circles and a clear scale from 0 to 100. This versatile element is ideal for corporate presentations, business reports, educational content, or any project requiring a sleek and engaging way to display data, statistics, or project progress. The animated nature enhances viewer engagement, making complex information easily digestible.