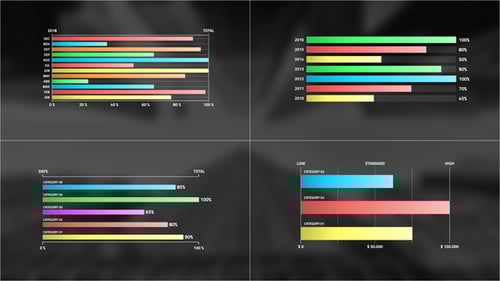
Animated Gantt Chart Infographics for Project Tracking and Business Planning
By seuramoeOne great value subscription from $16.50/month
- Unlimited downloads of 27+ million creative assets
- AI Tools: video, image and more
- Lifetime commercial license
- Easy cancellation
Already have an account? Sign in
Attributes
- Length
- 0:10
- Resolution
- 1920 x 1080
- File Size
- 5.1 MB
- Application Supported
- Premiere Pro
- Required Plugin
- None required
- Commercial License
- Further Information
Description
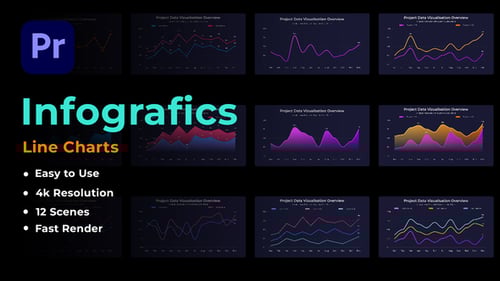
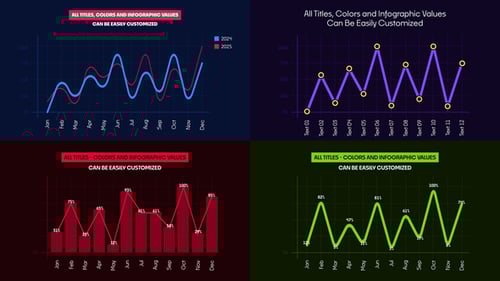
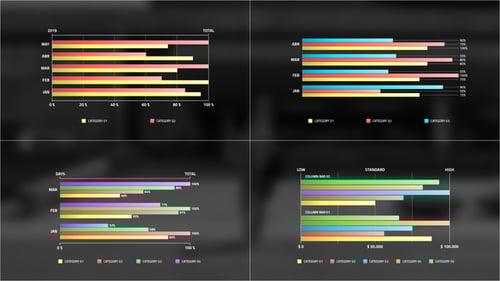
Visualize project timelines and task progress with these dynamic Gantt chart infographics. This template provides a clean and modern solution for illustrating planning, production, and evaluation phases across months or years. Featuring easily customizable bars that animate to show completion percentages and durations, these charts are perfect for business presentations, corporate reports, educational materials, or any project requiring clear, professional data visualization. Efficiently track various stages like investigation, interviews, and final report compilation with an intuitive, organized design.
Audio used in this item