
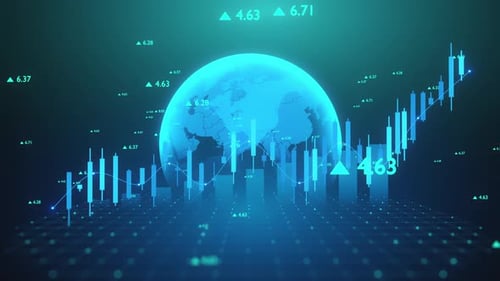
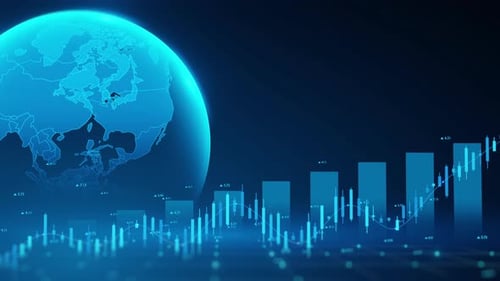
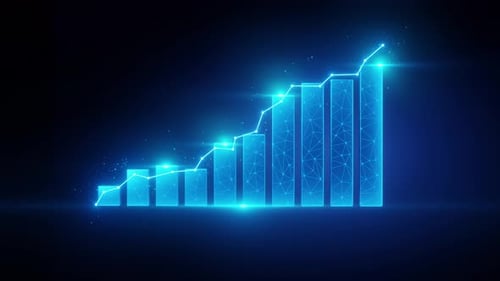
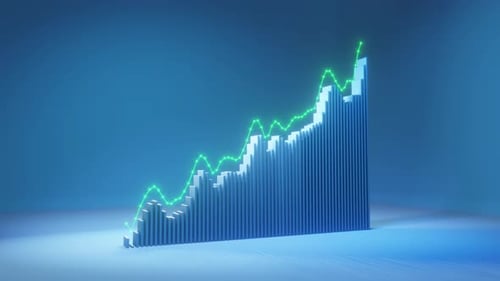
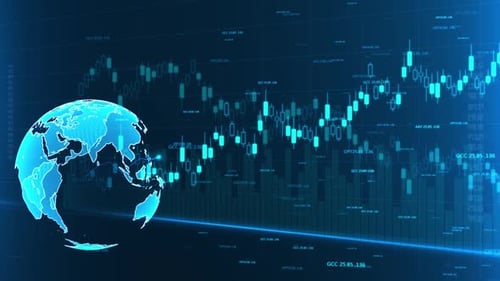
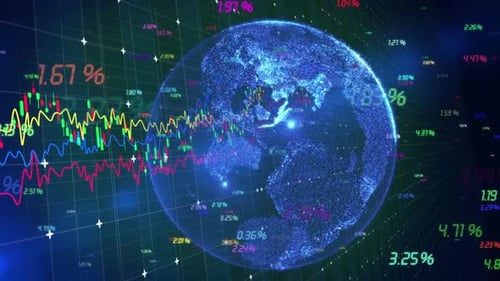
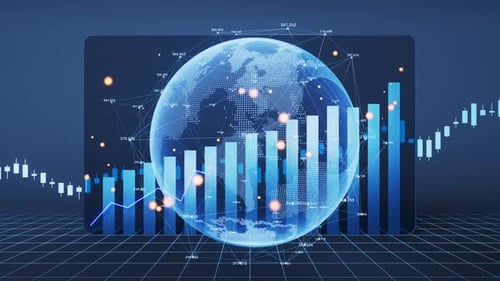
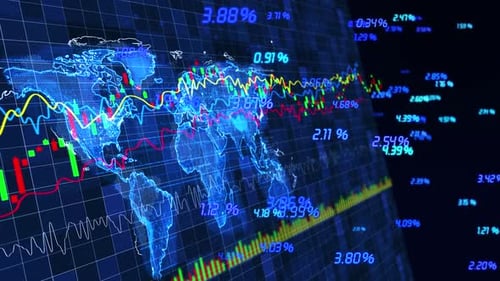
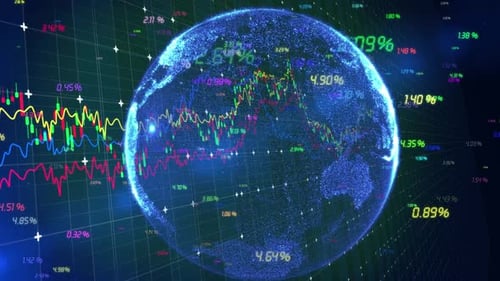
Global Financial Data with Candlestick ChartsGlobal Financial Market Growth Concept
By pingingzOne great value subscription from $16.50/month
- Unlimited downloads of 27+ million creative assets
- AI Tools: video, image and more
- Lifetime commercial license
- Easy cancellation
- Length
- 0:10
- Resolution
- 3840 x 2160
- File Size
- 64.9 MB
- Frame Rate
- 30 fps
- Alpha Channel
- No
- Looped
- No
- Video Encoding
- H.264
- Orientation
- Horizontal
- Commercial License
- Further Information
Description
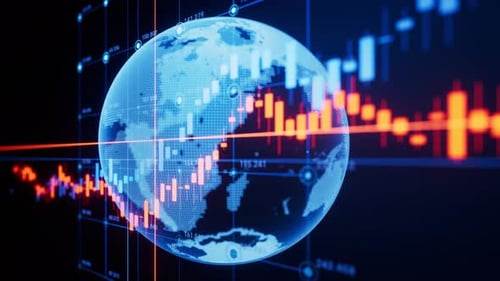
This animated visual presents a dynamic representation of global business and financial data. A translucent, glowing blue globe spins slowly at the center, overlaid with a digital network of interconnected points and lines, symbolizing global connectivity and data flow. Surrounding the globe, animated candlestick charts and bar graphs rise and fall, depicting abstract financial trends and market fluctuations. Small numerical values and data points continuously appear and disappear, adding to the sense of real-time data processing. The overall aesthetic is sleek, futuristic, and technological, dominated by vibrant blue and cyan hues. This asset is ideal for corporate presentations, financial reports, technology explainers, and any project requiring a sophisticated visual metaphor for global markets, data analysis, or technological innovation. It effectively conveys concepts of global finance, digital economics, and interconnected business operations with a professional and modern look.


.jpg?w=500&cf_fit=cover&q=85&format=auto&s=b28ef5fa99a4b83e66f3920eab7dc1cffe075025832f839802d8cf3111c66176)