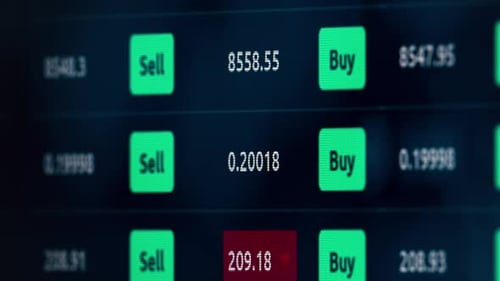
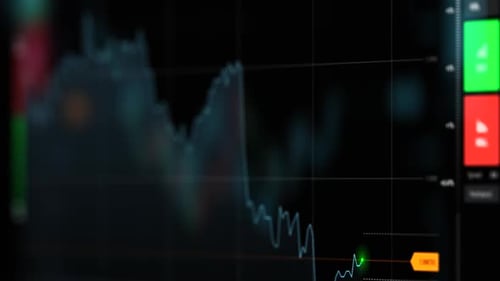
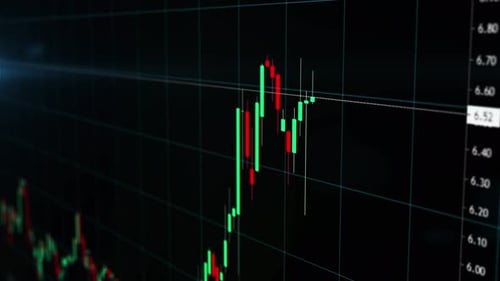
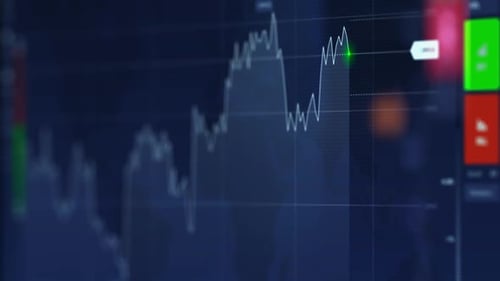
Graph of Crypto Currency Online. Quotes of Eth and Btc at Stock Exchange. Stock Exchange Market
By olegbadakOne great value subscription from $16.50/month
- Unlimited downloads of 27+ million creative assets
- AI Tools: video, image and more
- Lifetime commercial license
- Easy cancellation
Already have an account? Sign in
Attributes
- Length
- 0:41
- Resolution
- 3840 x 2160
- File Size
- 1.17 GB
- Frame Rate
- 25 fps
- Alpha Channel
- No
- Looped
- No
- Video Encoding
- H.264
- Orientation
- Horizontal
- Commercial License
- Further Information
Description
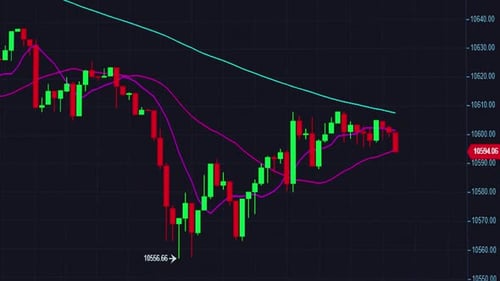
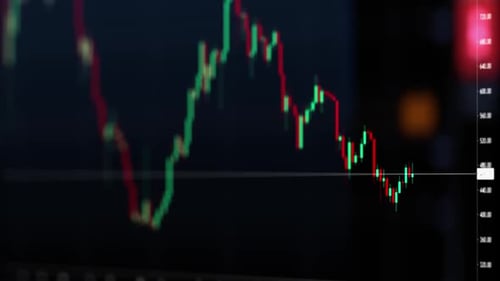
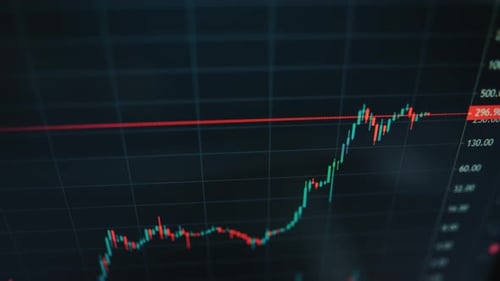
Dynamic close up of a monitor showing a line chart. The chart consists of green and red candlesticks, set against a dark blue grid. The line is constantly fluctuating, rising and falling over time. The changing values of the candlestick chart reflect market dynamics and financial volatility. Great for use in projects discussing economics, finance, technology, investing, and market analysis.


All
Music
Sound Effects