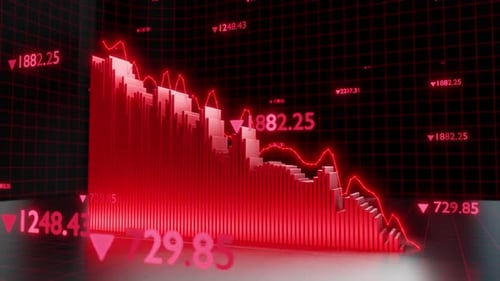
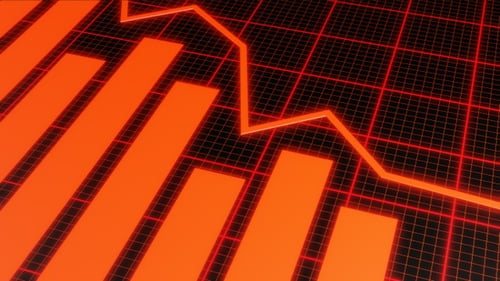
Animated Red Bar and Line Graph Showing Financial Data Decline
By pingingzOne great value subscription from $16.50/month
- Unlimited downloads of 27+ million creative assets
- AI Tools: video, image and more
- Lifetime commercial license
- Easy cancellation
Already have an account? Sign in
Attributes
- Length
- 0:14
- Resolution
- 3840 x 2160
- File Size
- 72 MB
- Frame Rate
- 25 fps
- Alpha Channel
- No
- Looped
- No
- Video Encoding
- H.264
- Orientation
- Horizontal
- Commercial License
- Further Information
Description
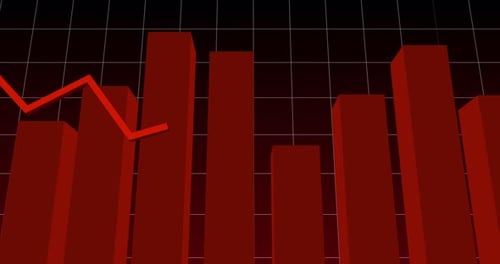
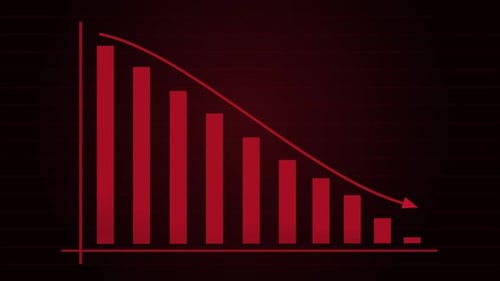
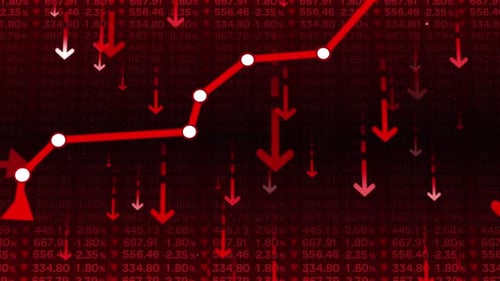
This animated visual effect presents a dynamic 3D bar chart and an overlying line graph, both prominently rendered in glowing red against a dark, grid-patterned background. The bars progressively rise, building from left to right, while the vibrant line graph fluidly traces a continuous downward trajectory above them. This striking animation is designed to effectively illustrate concepts of financial decline, market downturns, business losses, or any data showing a negative trend. Its clean, modern aesthetic with strong geometric elements makes it suitable for corporate presentations, financial reports, news segments, or any project requiring a clear, impactful representation of decreasing values.