Animated Global Data Infographic with World Map and Statistics
By Danil_RudenkoOne great value subscription from $16.50/month
- Unlimited downloads of 27+ million creative assets
- AI Tools: video, image and more
- Lifetime commercial license
- Easy cancellation
- Length
- 0:15
- Resolution
- 3840 x 2160
- File Size
- 98.8 MB
- Frame Rate
- 25 fps
- Alpha Channel
- No
- Looped
- No
- Video Encoding
- H.264
- Orientation
- Horizontal
- Commercial License
- Further Information
Description
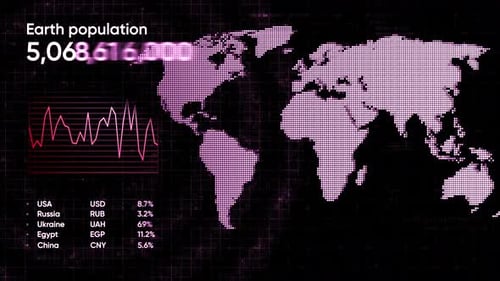
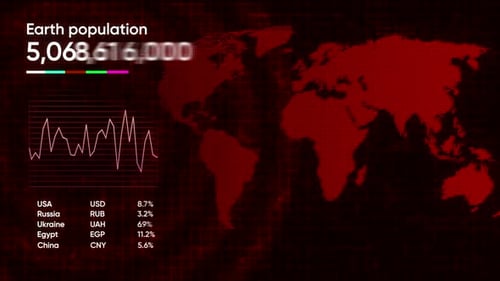
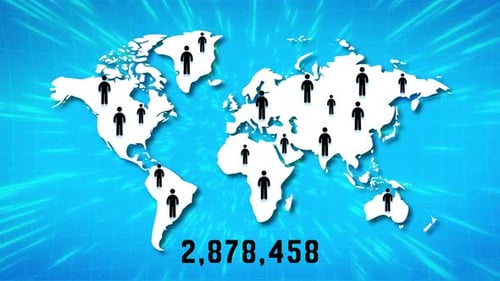
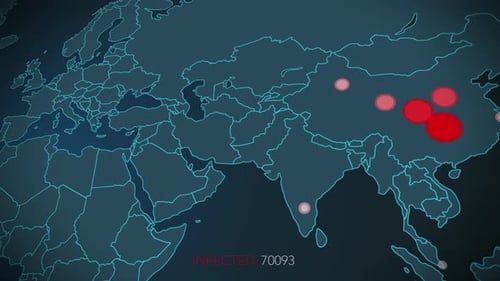
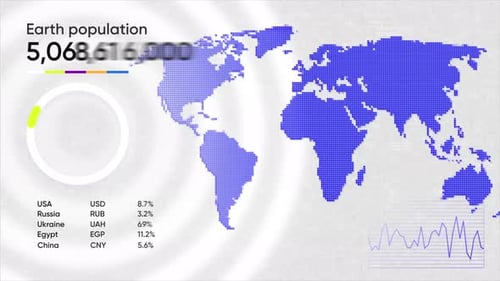
This animated infographic presents dynamic global data visualizations, featuring a world map that fills with dots representing activity or information. A prominent counter displays the Earth's population, incrementing rapidly, while a circular progress bar animates to show proportions using distinct color segments. Accompanying data includes a list of countries with their currency codes and percentages, visually connected to corresponding regions on the map by animated lines. A real-time line graph further illustrates trending data. This clean, digital display uses a minimalist style with precise movements, making it ideal for corporate presentations, business reports, educational content, or any project requiring a clear, engaging visual explanation of statistical or demographic trends. It provides a sophisticated and modern way to present complex information, enhancing viewer comprehension.