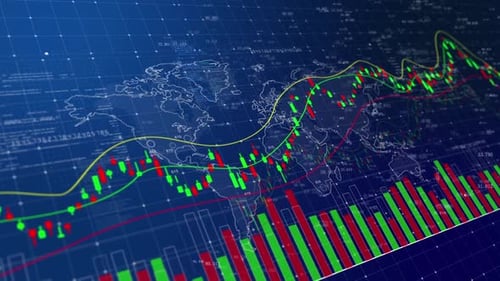
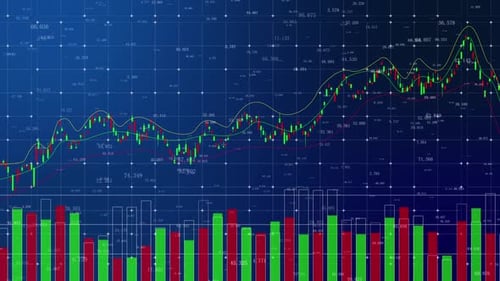
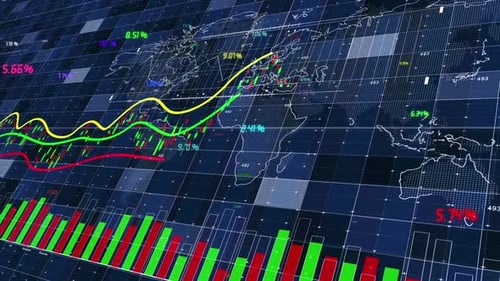
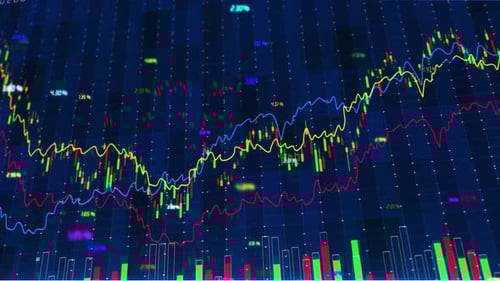
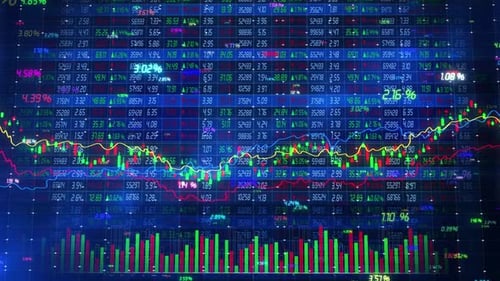
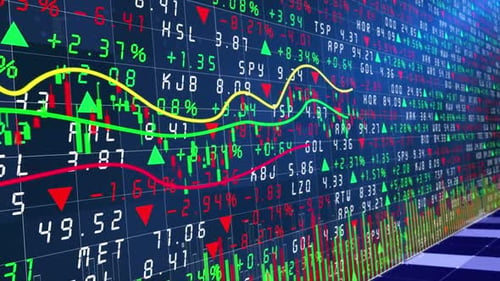
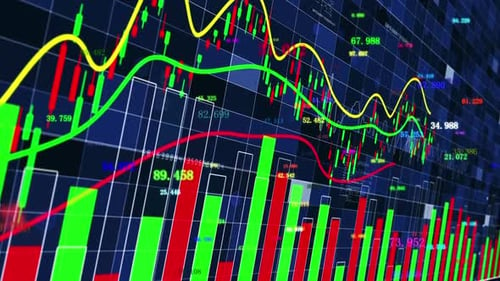
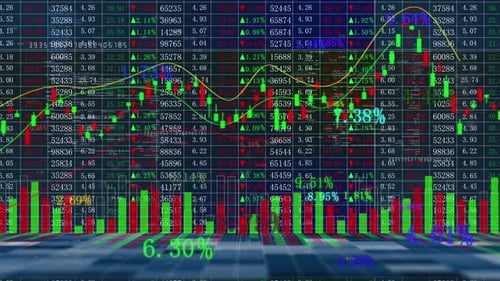
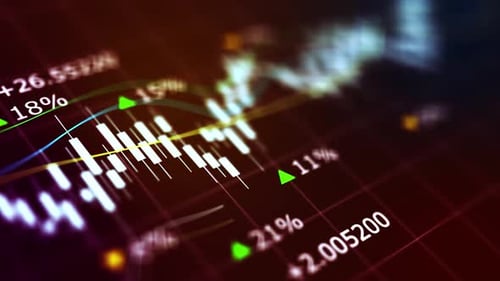
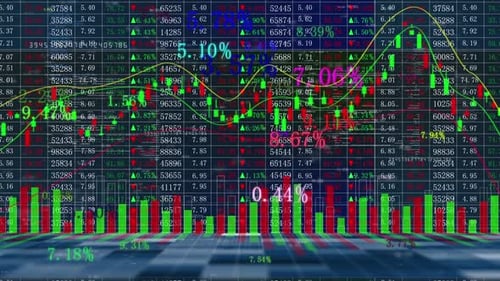
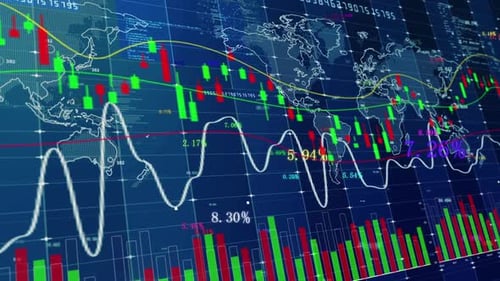
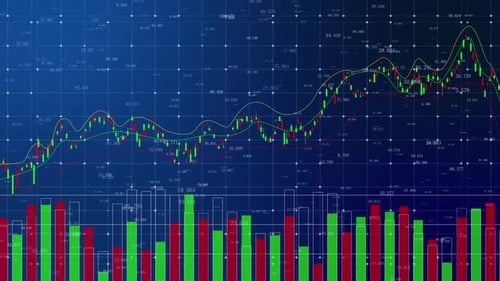
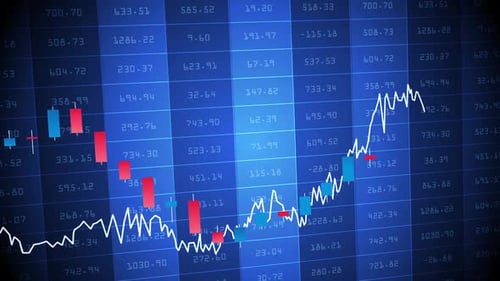
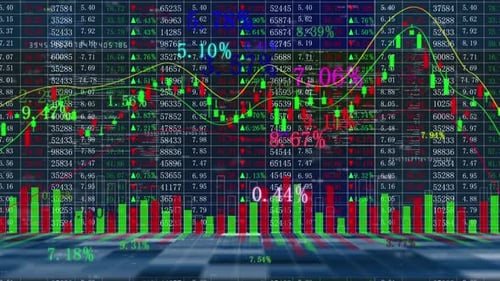
K-Line Trend Chart Showing Financial Market Movement
By XtremelevelOne great value subscription from $16.50/month
- Unlimited downloads of 27+ million creative assets
- AI Tools: video, image and more
- Lifetime commercial license
- Easy cancellation
Already have an account? Sign in
Attributes
- Length
- 0:12
- Resolution
- 1920 x 1080
- File Size
- 78.1 MB
- Frame Rate
- 25 fps
- Alpha Channel
- No
- Looped
- No
- Video Encoding
- H.264
- Orientation
- Horizontal
- Commercial License
- Further Information
Description
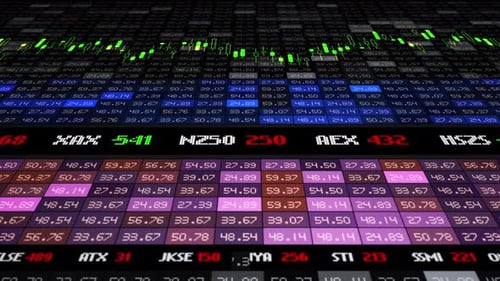
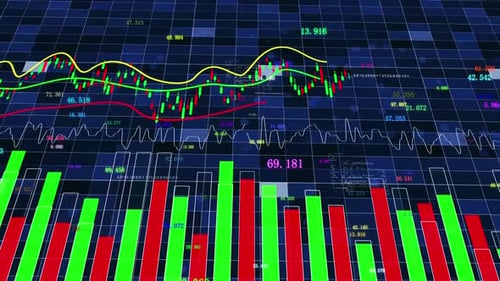
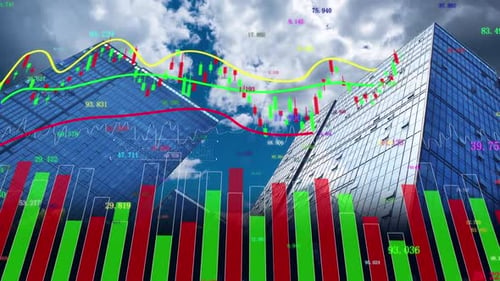
This dynamic animated clip showcases a sophisticated digital financial data display, featuring a constantly evolving stock market overview. Vibrant line graphs, detailed candlestick charts, and responsive bar graphs track fluctuating numbers and economic trends in real-time. The visual effect presents complex information with a clean, high-tech aesthetic against a dark, gridded background. This visual asset is ideal for enhancing business presentations, financial reports, technology-focused content, or any project requiring a professional and engaging depiction of data analysis and market performance.