Moving Array Of Stock Market Infographics
By ConceptCafeOne great value subscription from $16.50/month
- Unlimited downloads of 27+ million creative assets
- AI Tools: video, image and more
- Lifetime commercial license
- Easy cancellation
Already have an account? Sign in
Attributes
- Length
- 0:20
- Resolution
- 1920 x 1080
- File Size
- 201 MB
- Frame Rate
- 25 fps
- Alpha Channel
- No
- Looped
- No
- Video Encoding
- ProRes
- Orientation
- Horizontal
- Commercial License
- Further Information
Description
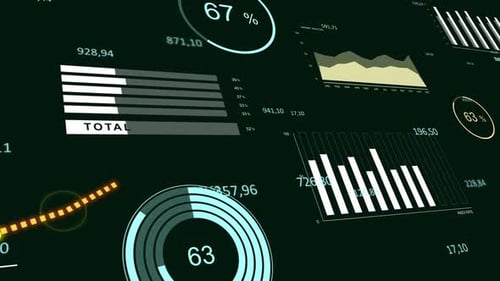
This animated display features a dynamic and interactive digital dashboard showcasing various data visualizations. The screen is filled with evolving line graphs, bar charts, circular percentage indicators, and data points, all rendered with a sleek modern aesthetic. Utilising a dark background grid with vibrant blue and orange highlights, the animation simulates real-time data analysis and financial tracking. This versatile visual asset is ideal for corporate presentations, technology-focused videos, business reports, or any project requiring a sophisticated representation of data processing and analytics.