Pie Charts | Flat Data Visualization
By motion-projectsOne great value subscription from $16.50/month
- Unlimited downloads of 27+ million creative assets
- AI Tools: video, image and more
- Lifetime commercial license
- Easy cancellation
Already have an account? Sign in
Attributes
- Length
- 0:08
- Resolution
- 1920 x 1080
- File Size
- 922 KB
- Application Supported
- After Effects
- Required Plugin
- None required
- After Effects Version
- CC
- Commercial License
- Further Information
Description
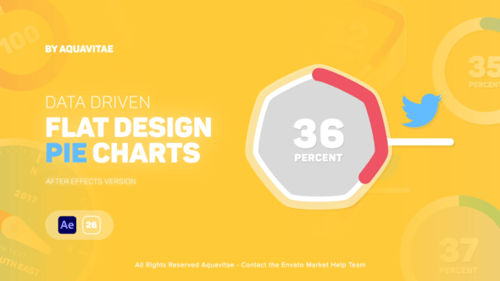
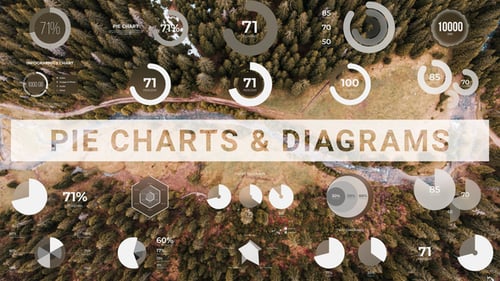
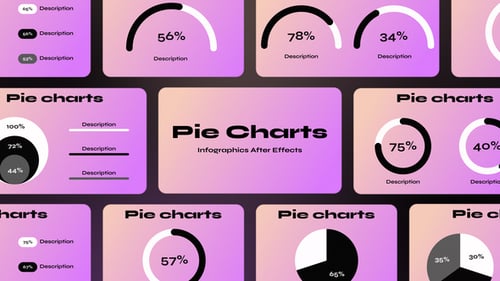
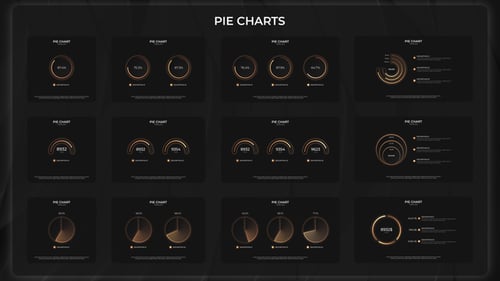
Pie Charts is a pack of 10 animated data visualization scenes in a clean flat design: pie and donut charts, semi donuts, progress rings, nested rings and market share breakdowns. Every scene comes in landscape 1920x1080, vertical 1080x1920 and square 1080x1080, so the same story works for presentations, YouTube, Reels, TikTok and social posts.
Type your own numbers and the charts follow: bars grow, slices split, lines draw and counters count up to the values you enter. Colors, number format and the closing wipe are set from one CONTROLLER layer. Smooth eased motion, bold Inter typography and the included help file make it quick to drop into reports, explainers and business videos.