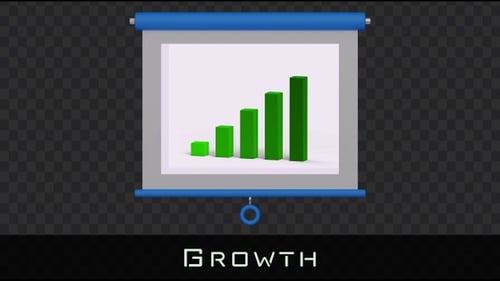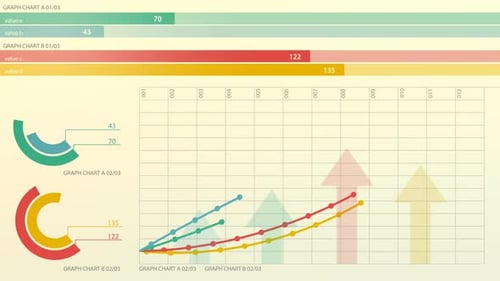
Animated Projector Screen with Business Line Graph Chart
By animxplore4One great value subscription from $16.50/month
- Unlimited downloads of 27+ million creative assets
- AI Tools: video, image and more
- Lifetime commercial license
- Easy cancellation
Already have an account? Sign in
Attributes
- Length
- 0:05
- Resolution
- 1920 x 1080
- File Size
- 42.6 MB
- Frame Rate
- 60 fps
- Alpha Channel
- Yes
- Looped
- Yes
- Video Encoding
- ProRes
- Orientation
- Horizontal
- Commercial License
- Further Information
Description
This clean and professional animated clip features a dynamic projector screen setup. The screen unfurls from a compact state, revealing a detailed line graph that illustrates upward trends in two distinct data sets, represented by vibrant green and orange lines. A clear legend animates alongside, identifying each data series. Designed with a modern flat aesthetic, this visual effect is perfect for enhancing business presentations, financial analyses, corporate reports, and any project requiring clear, engaging data visualization. It offers a straightforward and impactful way to convey growth and statistical information.