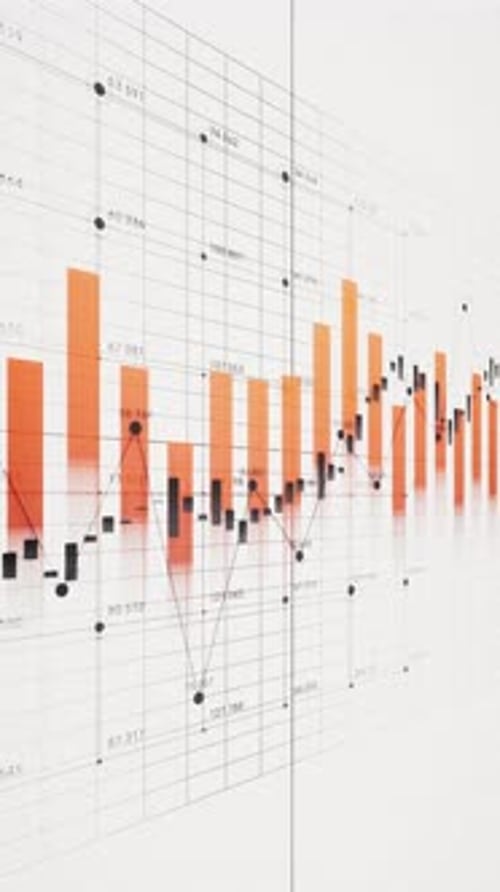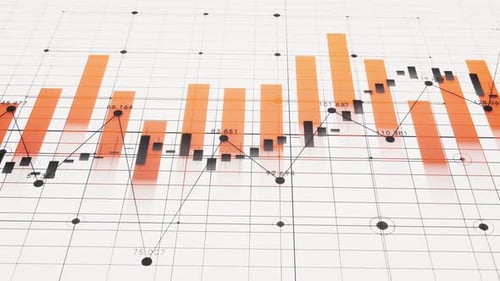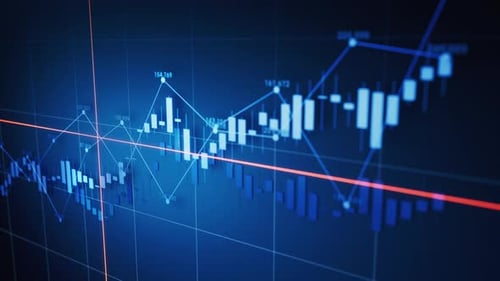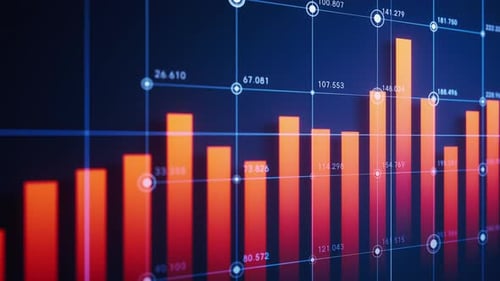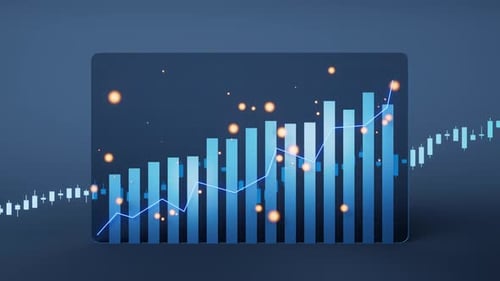
Digital Stock Market Growth Chart with Futuristic Data Analysis
By vinkfanOne great value subscription from $16.50/month
- Unlimited downloads of 27+ million creative assets
- AI Tools: video, image and more
- Lifetime commercial license
- Easy cancellation
Already have an account? Sign in
Attributes
- Length
- 0:10
- Resolution
- 3840 x 2160
- File Size
- 764 MB
- Frame Rate
- 30 fps
- Alpha Channel
- No
- Looped
- No
- Video Encoding
- ProRes
- Orientation
- Horizontal
- Commercial License
- Further Information
Description
This dynamic animated clip showcases a futuristic financial growth chart, presented in a sleek 3D environment. Glowing orange and blue lines trace fluctuating data points across a dark blue background, while rising bar graphs and numeric indicators constantly update, illustrating progress and analysis. The digital interface suggests advanced technological insights and financial market trends. This visual effect enhances corporate presentations, financial reports, and technology-focused content, conveying a sense of innovation, data-driven decision-making, and market growth with its clean, modern aesthetic.