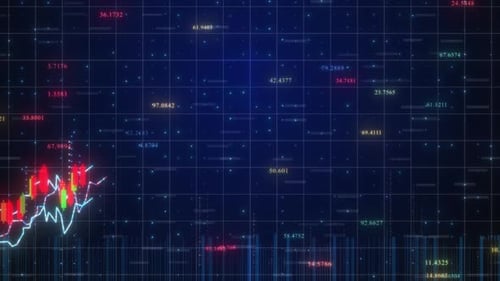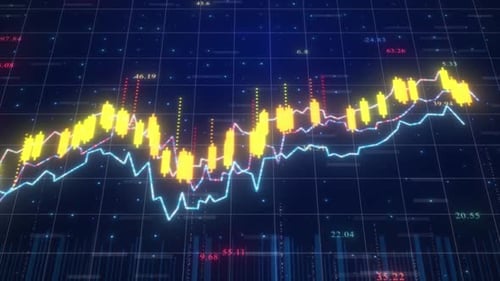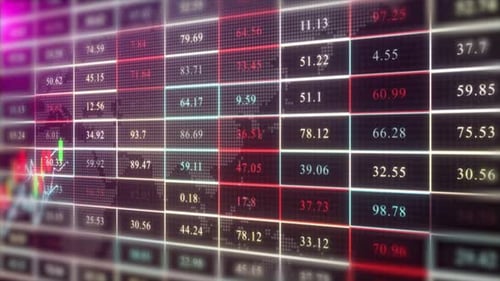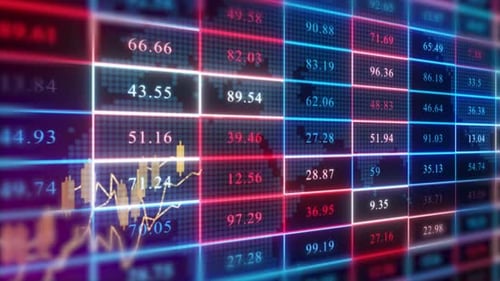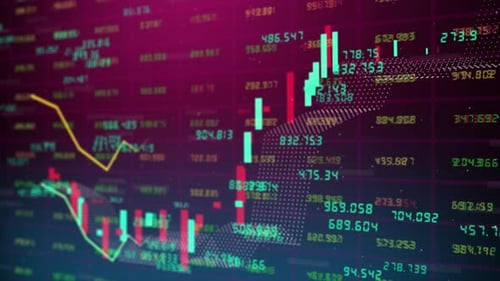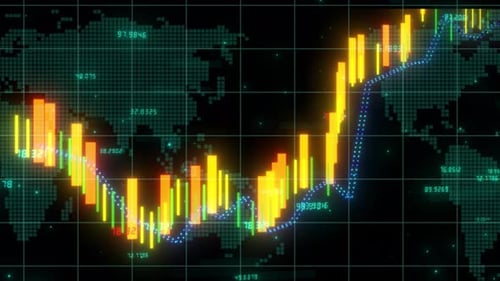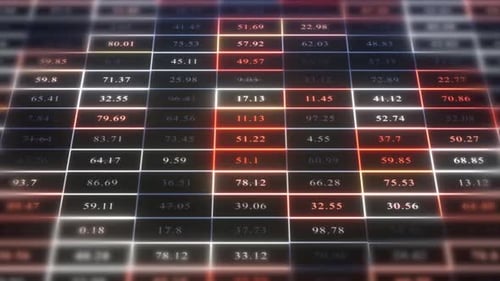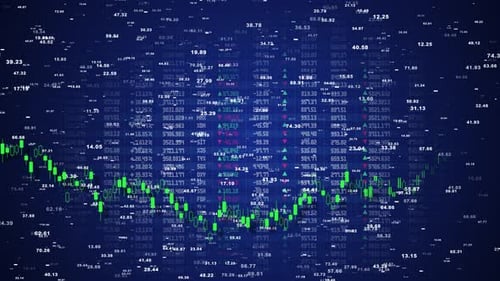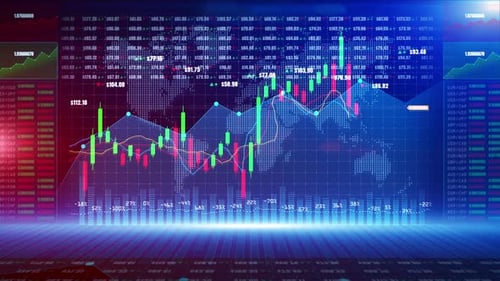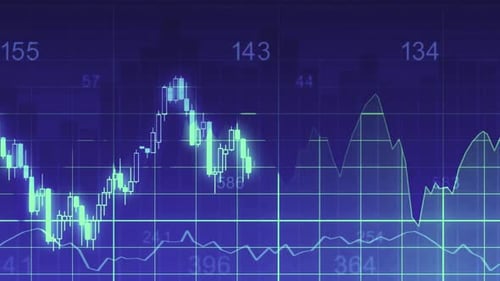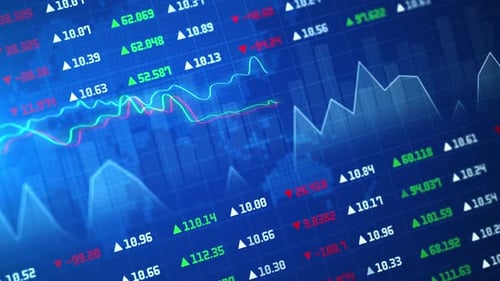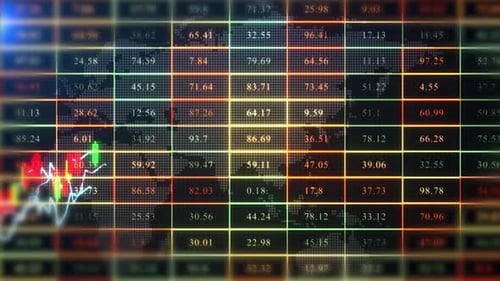
Stock Chart With Candle Stick Patter Rising With Number Animation Background, Stock Market Analysis
By 4kmotionworldsOne great value subscription from $16.50/month
- Unlimited downloads of 27+ million creative assets
- AI Tools: video, image and more
- Lifetime commercial license
- Easy cancellation
- Length
- 0:14
- Resolution
- 3840 x 2160
- File Size
- 157 MB
- Frame Rate
- 29.97 fps
- Alpha Channel
- No
- Looped
- No
- Video Encoding
- H.264
- Orientation
- Horizontal
- Commercial License
- Further Information
Description
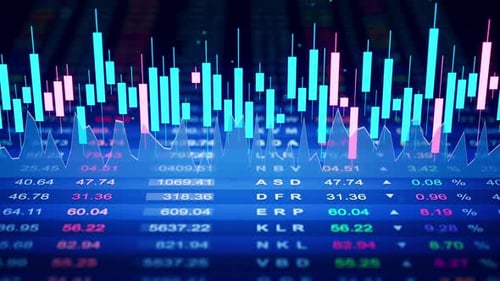
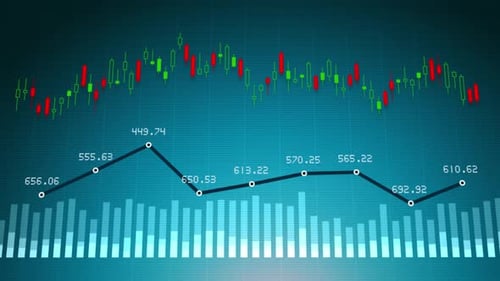
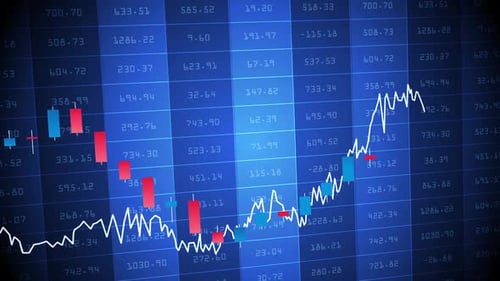
This animated background features a dynamic digital display of financial data, showcasing a continuously updating grid of glowing numbers and an overlay of animated candlestick and line charts. The fluctuating red and green candles intuitively indicate market trends, representing upward and downward movements, while the intricate white and blue line graphs illustrate real-time price movements and historical data. All of this is set against a subtle, dotted world map, suggesting global reach and interconnectedness of financial markets. The modern, tech-driven aesthetic, characterized by its sharp lines, digital glows, and subtle depth of field, creates a sophisticated and engaging visual. This asset is ideally suited for corporate presentations, financial news broadcasts, economic analysis videos, and any project requiring a high-tech data visualization backdrop to convey market activity, growth, or decline. It effectively communicates complex information in a visually compelling and professional manner, enhancing reports, documentaries, and digital interfaces related to finance, economics, and business intelligence.