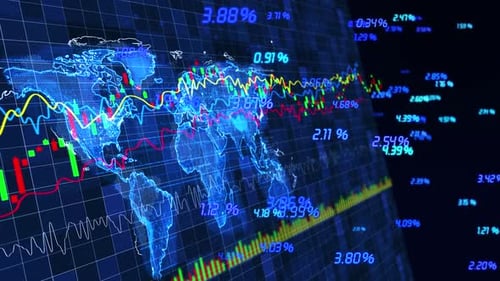
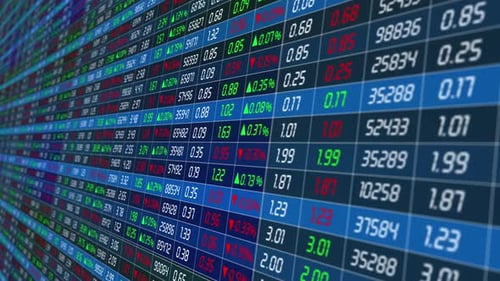
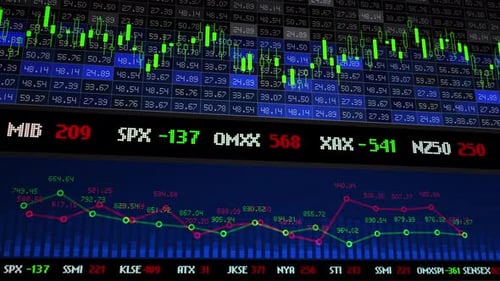
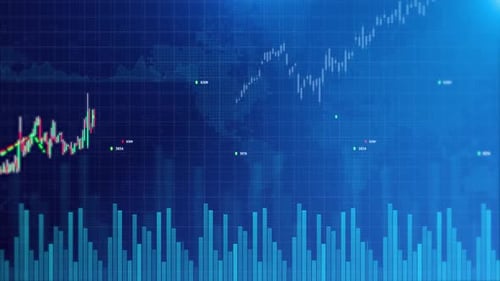
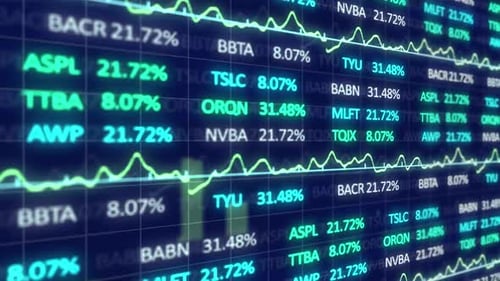
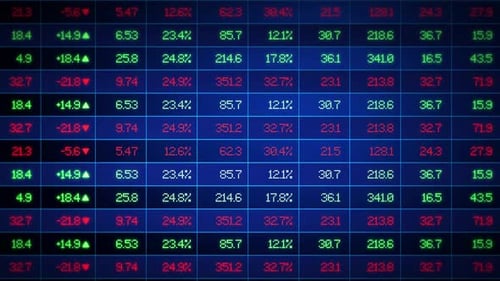
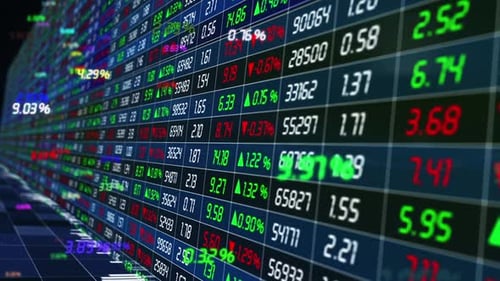
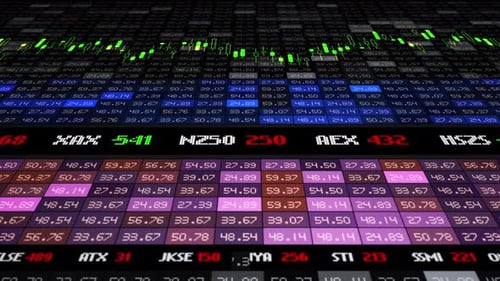
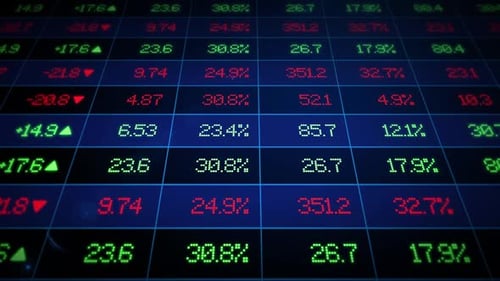
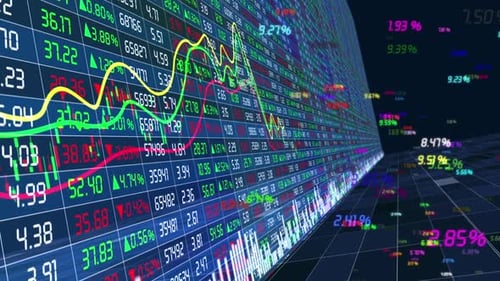
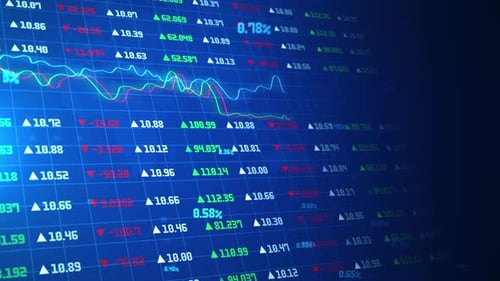
Stock Financial Market Curve Chart
By 17635106560One great value subscription from $16.50/month
- Unlimited downloads of 27+ million creative assets
- AI Tools: video, image and more
- Lifetime commercial license
- Easy cancellation
- Length
- 0:13
- Resolution
- 1920 x 1080
- File Size
- 86 MB
- Frame Rate
- 25 fps
- Alpha Channel
- No
- Looped
- No
- Video Encoding
- H.264
- Orientation
- Horizontal
- Commercial License
- Further Information
Description
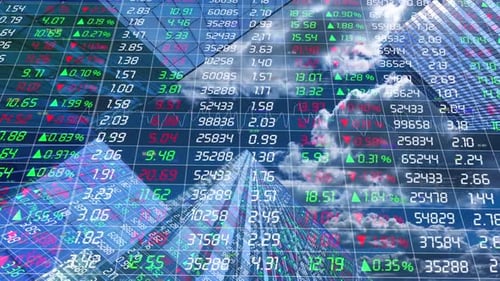
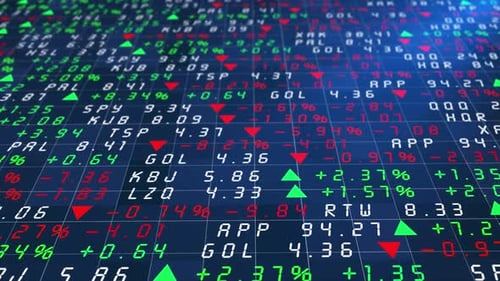
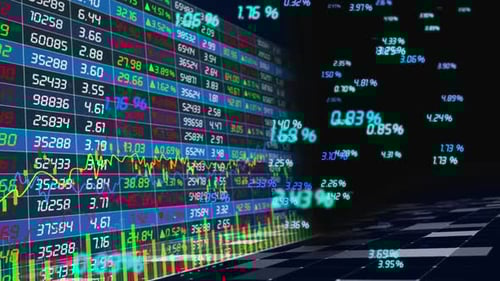
This animation features a dynamic digital display of financial stock market data. The left side presents a complex stock ticker board with fluctuating numbers in red, green, and blue, accompanied by line graphs and bar charts illustrating market trends. On the right, numerous glowing blue and green percentage values float and dissipate against a dark, gridded background, representing active data changes. This digital backdrop is perfect for corporate presentations, financial news broadcasts, investment firm advertisements, or any project requiring a sophisticated visualization of data and economic activity. It conveys rapid information flow and analytical insight, enhancing content related to global markets, business strategy, and technological finance.