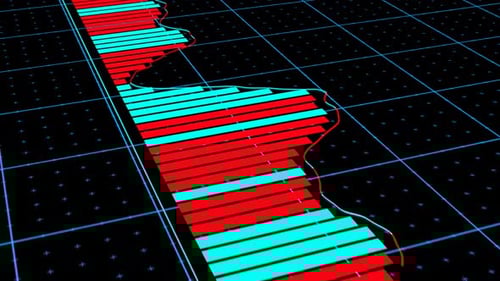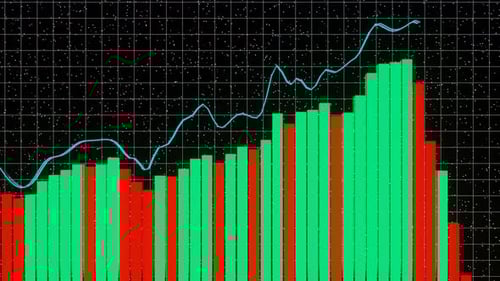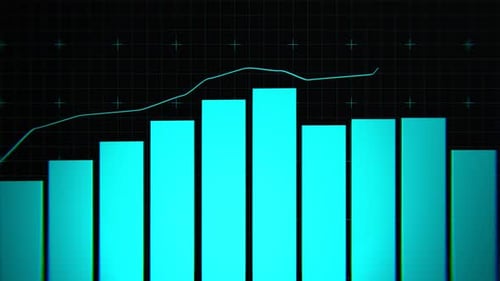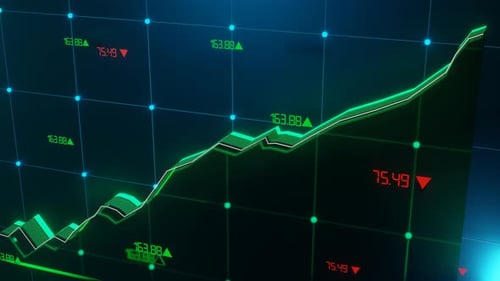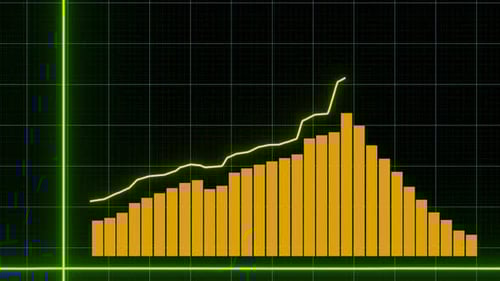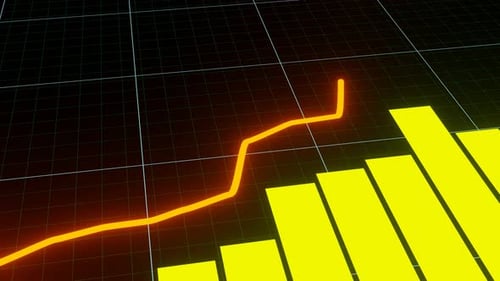
Futuristic Bar Chart and Line Graph Data Animation
By CESM_StudioOne great value subscription from $16.50/month
- Unlimited downloads of 27+ million creative assets
- AI Tools: video, image and more
- Lifetime commercial license
- Easy cancellation
- Length
- 0:12
- Resolution
- 3840 x 2160
- File Size
- 8.95 MB
- Frame Rate
- 24 fps
- Alpha Channel
- No
- Looped
- No
- Video Encoding
- H.264
- Orientation
- Horizontal
- Commercial License
- Further Information
Description
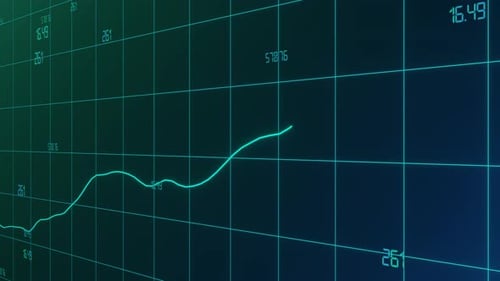
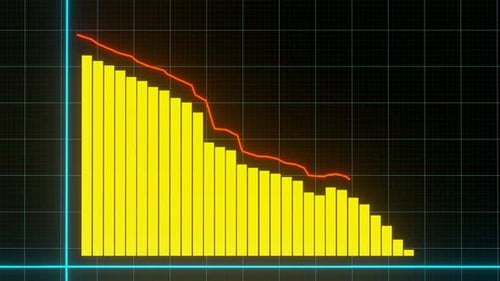
This animated data visualization features a dynamic bar chart that progressively expands from left to right, illustrating quantitative data over time. Simultaneously, a vibrant red line graph plots above the bars, indicating trends, fluctuations, or comparative analysis. The background is a stark black grid with glowing cyan axes and subtle grid lines, creating a high-tech, futuristic aesthetic. This clean and precise animation is perfect for enhancing corporate presentations, financial reports, technological explainers, scientific data analysis, or any project requiring a clear and engaging display of statistical information. Its dynamic movement effectively communicates growth, decline, or comparative data points in a sleek, modern visual style, adding a professional and sophisticated touch to informational content.