Dynamic Financial Trading Infographics and Data Visualizations
By ConceptCafeOne great value subscription from $16.50/month
- Unlimited downloads of 27+ million creative assets
- AI Tools: video, image and more
- Lifetime commercial license
- Easy cancellation
- Length
- 0:16
- Resolution
- 3840 x 2160
- File Size
- 518 MB
- Application Supported
- After Effects
- Required Plugin
- None required
- After Effects Version
- CS6
- Commercial License
- Further Information
Description
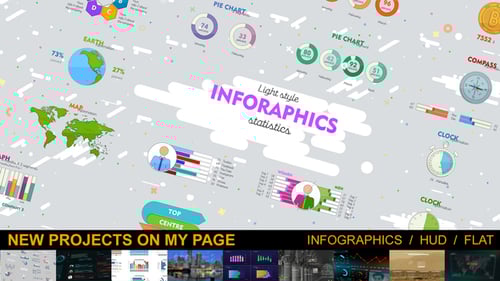
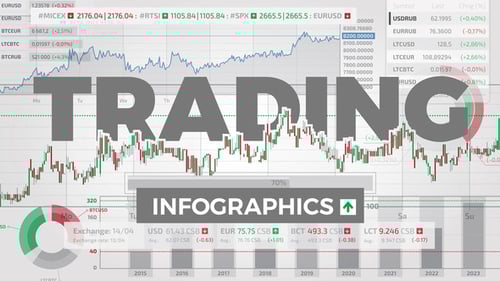
This comprehensive video template offers a suite of dynamic financial infographics and data visualizations tailored for trading and business presentations. Featuring animated stock charts, line graphs, pie charts, and customizable exchange rate tables, it provides a professional and clear way to display complex financial data. Users can recreate real course movements or quickly adjust growth and fall rates for various scenarios. The template includes flexible color customization settings and three ready-made styles—Classic, Dark, and Modern—to fit diverse branding needs. Perfect for illustrating video presentations, creating trading platform interfaces, or designing mobile trading apps, this template empowers users to communicate financial insights effectively.
Audio used in this item