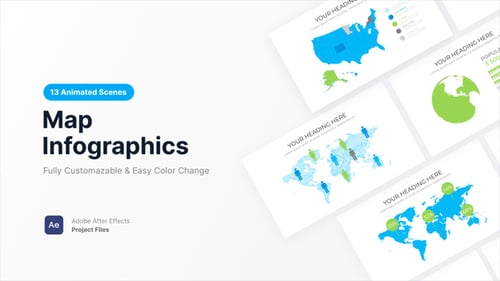
Animated United States Map Infographic for Data Visualization
By DREAMYARD_VisualsOne great value subscription from $16.50/month
- Unlimited downloads of 27+ million creative assets
- AI Tools: video, image and more
- Lifetime commercial license
- Easy cancellation
Already have an account? Sign in
Attributes
- Length
- 2:57
- Resolution
- 3840 x 2160
- File Size
- 79.9 MB
- Application Supported
- After Effects
- Required Plugin
- None required
- After Effects Versions
- CC 2019, CC 2018
- Commercial License
- Further Information
Description
USA Map with individual States Control and Additional Elements such as Overlay dots and Info Boxes.
It is 4k and 60 fps ready!
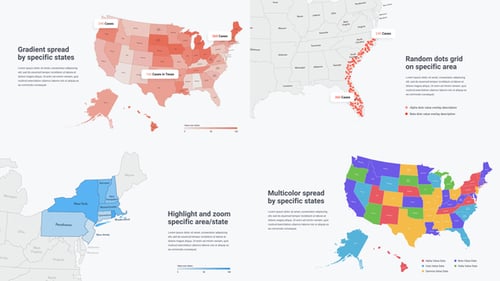
You can Use Mono Color Map to use relative values for every state to show difference between states in one gradient color.
You can Use Multi Color Map to use different colors (up to 5 colors) for every state to show difference between states with different colors.
Overlay Dots - You can Cover specific areas (manually picked with pen tool) with dots
Changes size and position of map to show specific areas closer. You can even animate these options to show different areas one-by-one