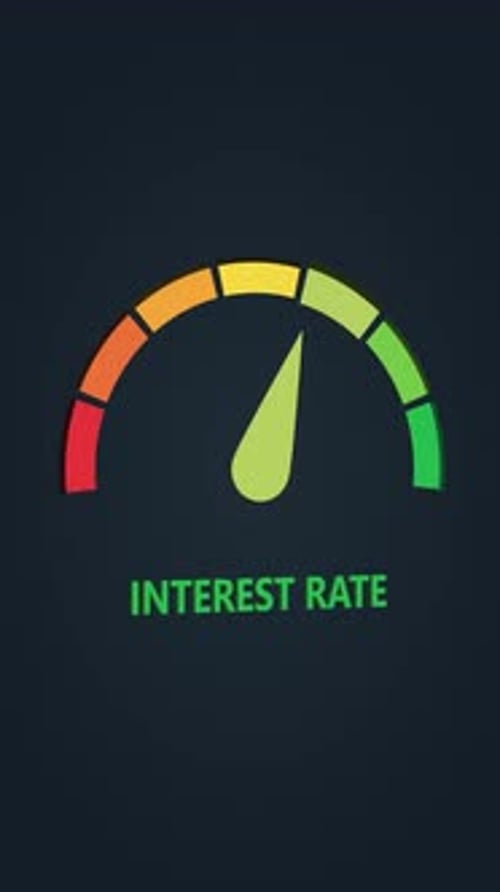
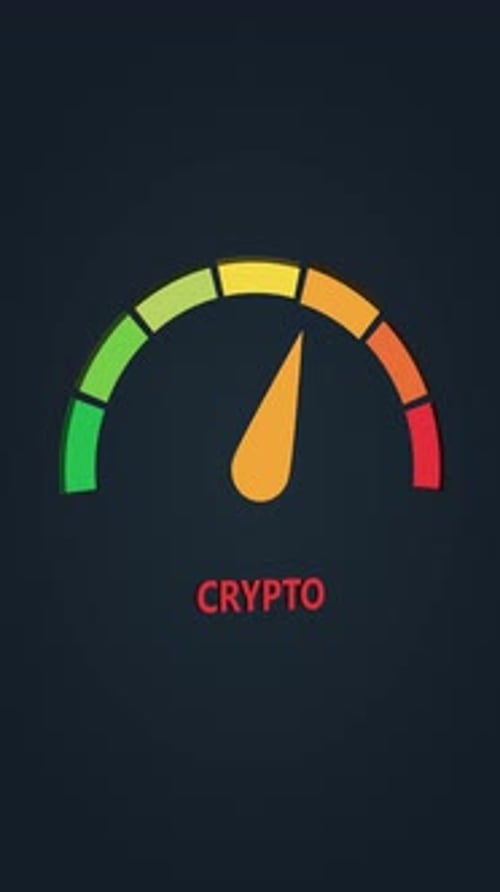
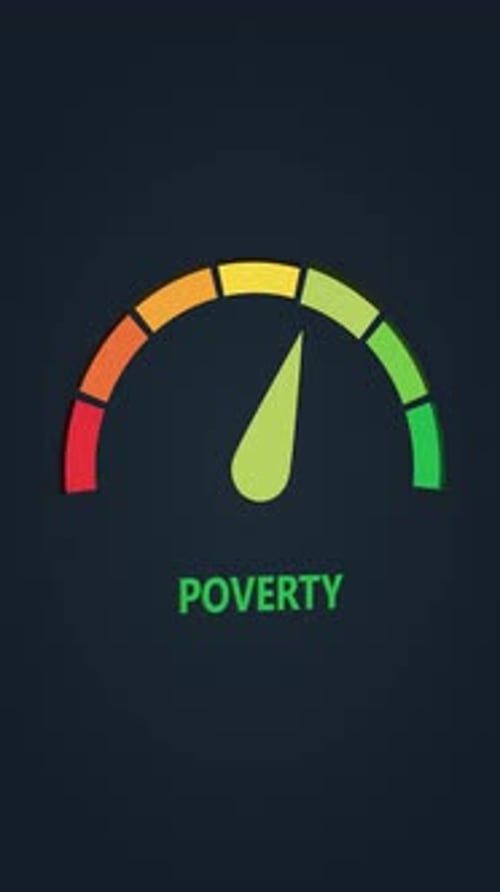
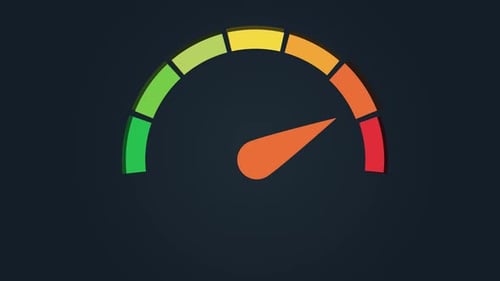
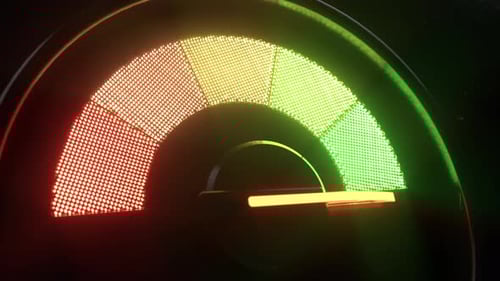
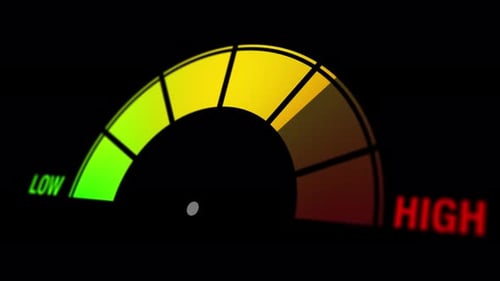
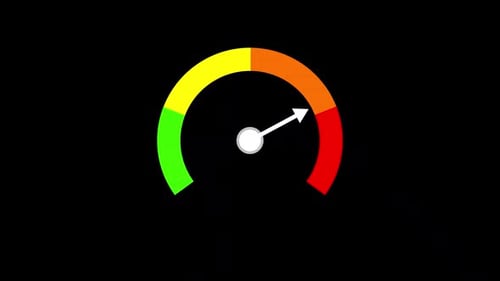
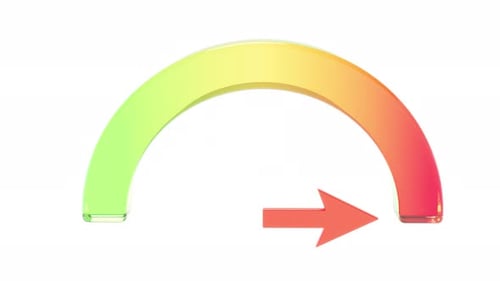
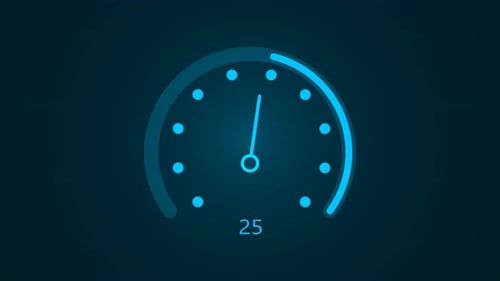
Animated Metric Gauge with Dynamic Progress Indicator
By CineHutOne great value subscription from $16.50/month
- Unlimited downloads of 27+ million creative assets
- AI Tools: video, image and more
- Lifetime commercial license
- Easy cancellation
Already have an account? Sign in
Attributes
- Length
- 0:10
- Resolution
- 2160 x 3840
- File Size
- 8.53 MB
- Frame Rate
- 30 fps
- Alpha Channel
- No
- Looped
- No
- Video Encoding
- H.264
- Orientation
- Vertical
- Commercial License
- Further Information
Description
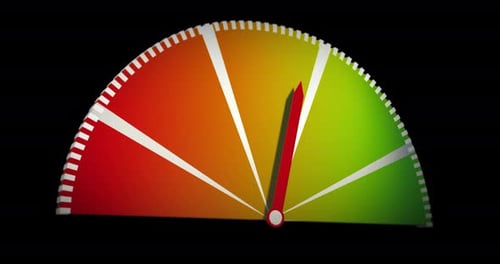
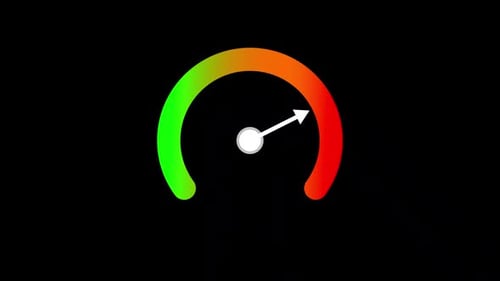
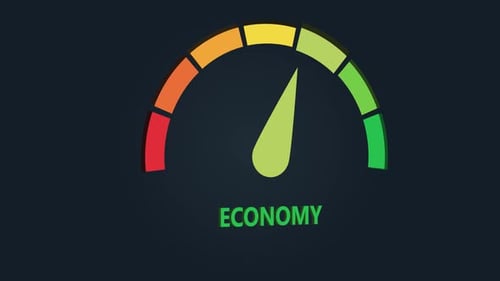
This clean, animated visual features a modern data gauge presented against a dark, minimalist background. The semicircular gauge is segmented into distinct color zones—red, orange, yellow, and green—to signify varying levels or thresholds. A dynamically moving needle sweeps smoothly across these segments, illustrating data progression or real-time metric changes. The graphic is designed to clearly present quantitative information, making it an excellent asset for presentations, educational videos, or business reports that require engaging and straightforward data visualization.