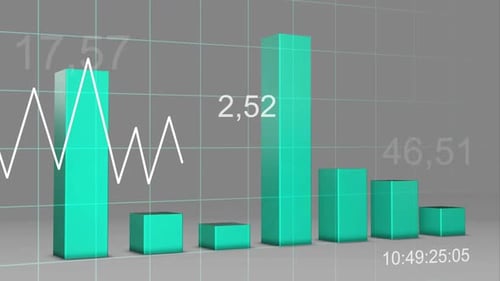
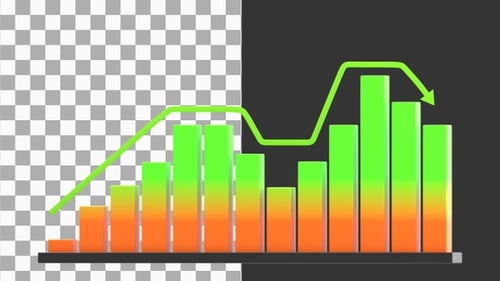
Volatile Market Multi Color Chart Bar Statistic 3D Loop
By NmotionOne great value subscription from $16.50/month
- Unlimited downloads of 27+ million creative assets
- AI Tools: video, image and more
- Lifetime commercial license
- Easy cancellation
Already have an account? Sign in
Attributes
- Length
- 0:10
- Resolution
- 1920 x 1080
- File Size
- 9.42 MB
- Frame Rate
- 29.97 fps
- Alpha Channel
- No
- Looped
- No
- Video Encoding
- H.264
- Orientation
- Horizontal
- Commercial License
- Further Information
Description
This dynamic animated clip showcases a vibrant 3D bar chart juxtaposed with an active white line graph, all set against a subtle grid background. The colorful bars fluctuate in height, representing changing data values, while transparent numerical overlays appear and disappear, highlighting specific points. The crisp, clean design and smooth animation create a professional and engaging visual. This versatile animation is perfect for enhancing corporate presentations, financial reports, business analyses, or any project requiring a clear and compelling visualization of trending data and statistics.