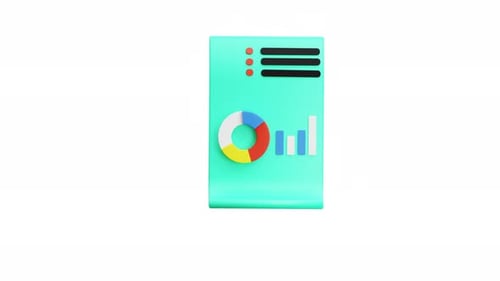
3D Animated Data Report with Pie and Bar Charts
By HayfanStudioOne great value subscription from $16.50/month
- Unlimited downloads of 27+ million creative assets
- AI Tools: video, image and more
- Lifetime commercial license
- Easy cancellation
Already have an account? Sign in
Attributes
- Length
- 0:06
- Resolution
- 3840 x 2160
- File Size
- 229 MB
- Frame Rate
- 30 fps
- Alpha Channel
- Yes
- Looped
- Yes
- Video Encoding
- ProRes
- Orientation
- Horizontal
- Commercial License
- Further Information
Description
This animated visual presents a dynamic 3D representation of data analysis. A digital document with rounded corners acts as a canvas, where a colorful pie chart, a growing bar graph, and illustrative text lines smoothly animate into view. Rendered in a clean, modern 3D style with soft colors and subtle shadows, the graphic offers a professional yet approachable aesthetic. Ideal for corporate presentations, business reports, educational content, or any project requiring clear and engaging data visualization, this motion graphic efficiently conveys statistical information with visual flair. It provides a polished way to introduce key metrics or illustrate trends.