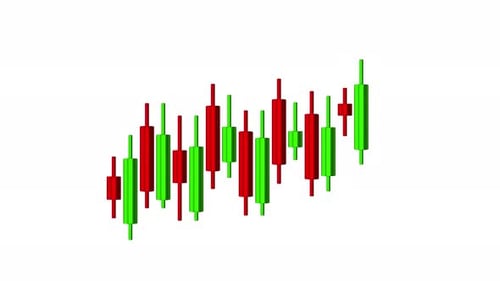
3D Financial Data Graph with Interactive Sliders Animation
By UnerispaceOne great value subscription from $16.50/month
- Unlimited downloads of 27+ million creative assets
- AI Tools: video, image and more
- Lifetime commercial license
- Easy cancellation
- Length
- 0:06
- Resolution
- 3840 x 2160
- File Size
- 123 MB
- Frame Rate
- 30 fps
- Alpha Channel
- Yes
- Looped
- No
- Video Encoding
- ProRes
- Orientation
- Horizontal
- Commercial License
- Further Information
Description
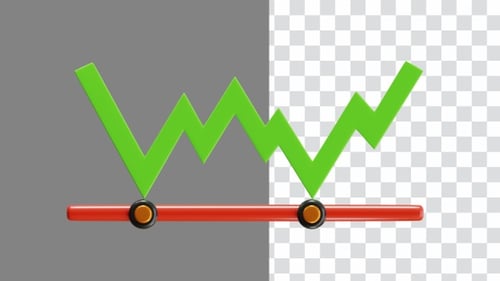
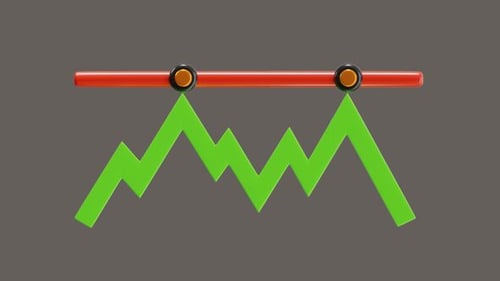
This dynamic 3D animation presents a clear and engaging financial data graph. A sleek red horizontal bar acts as a timeline, featuring two interactive circular sliders that glide along its path. Below, a vibrant green zigzag line, symbolizing fluctuating data or market trends, dynamically adjusts in response to the slider movements. The animation effectively illustrates changes in values, highlighting periods of growth and decline. With its clean, modern aesthetic and smooth 3D rendering, this visual element is perfect for corporate presentations, financial analyses, business reports, and educational content. It provides a professional and intuitive way to visualize adjustable data or performance metrics in various digital media projects.