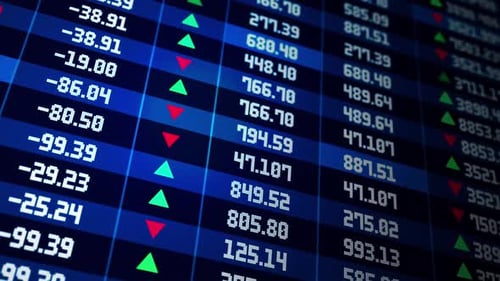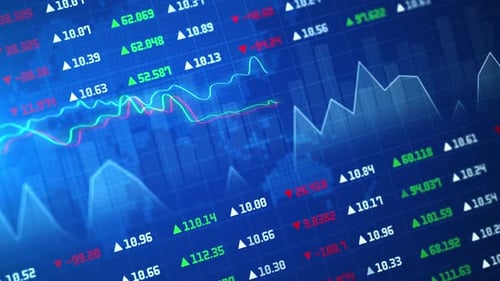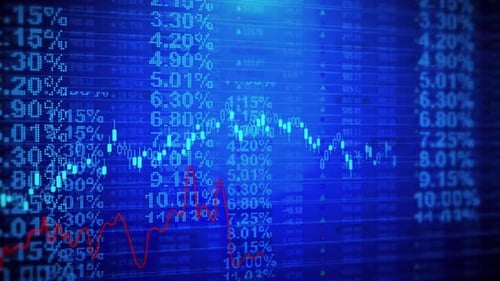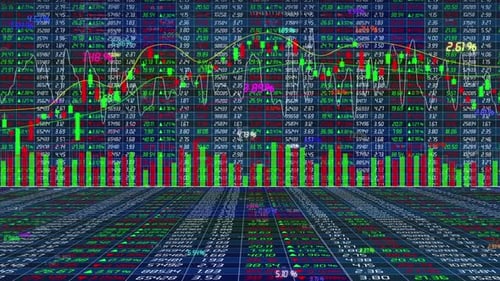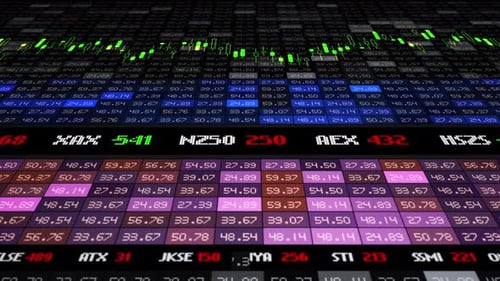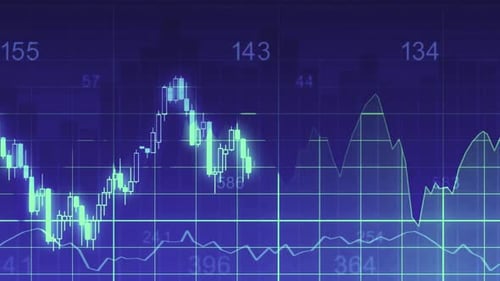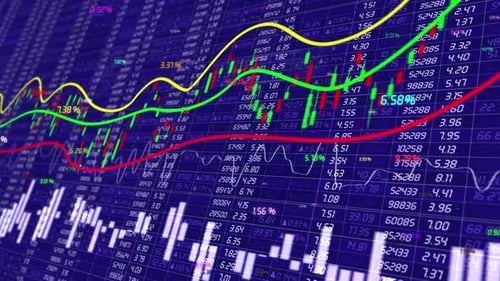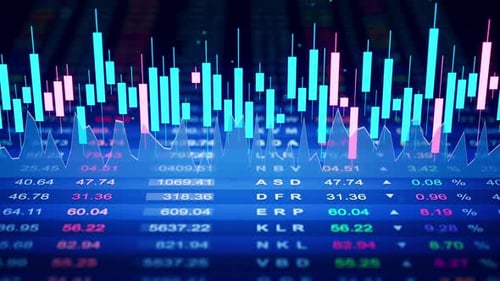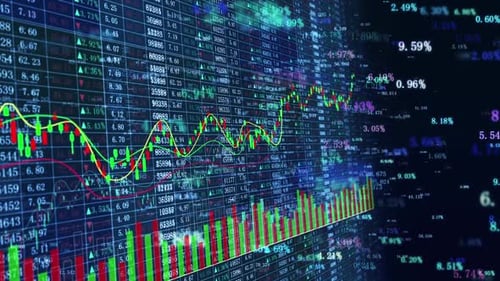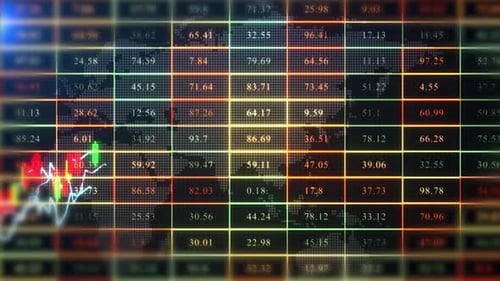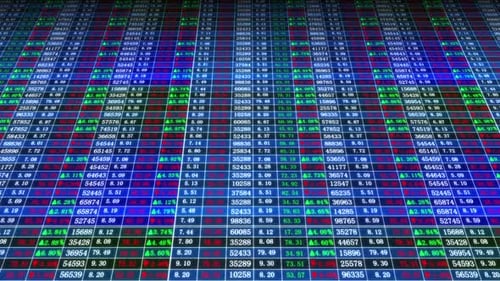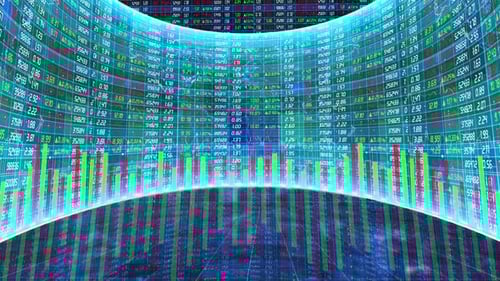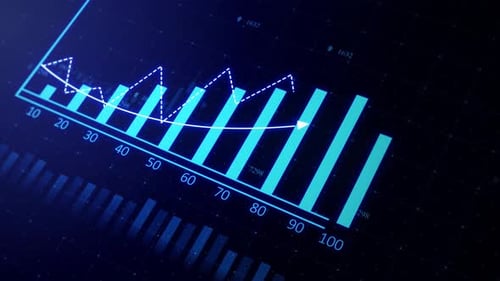
3D Investing and Stock Market Concept Gain and Profits with Faded Candlestick Charts
By Infi_StudioOne great value subscription from $16.50/month
- Unlimited downloads of 27+ million creative assets
- AI Tools: video, image and more
- Lifetime commercial license
- Easy cancellation
Already have an account? Sign in
Attributes
- Length
- 0:25
- Resolution
- 4096 x 2304
- File Size
- 98 MB
- Frame Rate
- 24 fps
- Alpha Channel
- No
- Looped
- No
- Video Encoding
- H.264
- Orientation
- Horizontal
- Commercial License
- Further Information
Description
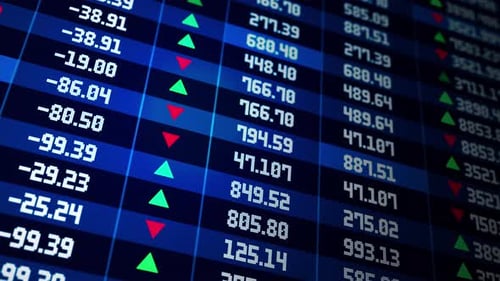
This animated display features dynamic stock market data, showcasing continuously changing numbers and real-time trend indicators. Green upward triangles signify gains, while red downward triangles indicate losses, all presented on a vibrant blue digital interface. The futuristic aesthetic, with its grid-like background and glowing numerals, creates a sophisticated and high-tech atmosphere. This visual is perfect for projects related to finance, business news, economic updates, corporate presentations, or any content requiring a modern and professional representation of financial analytics and market activity.