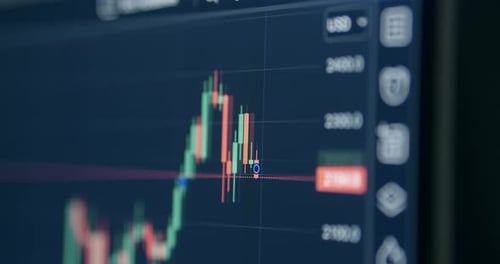
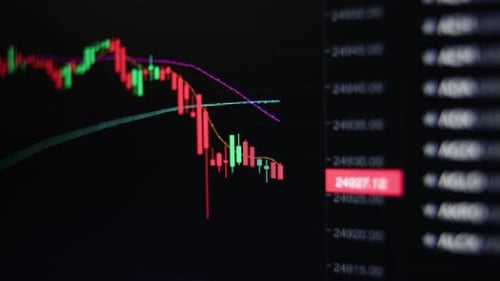
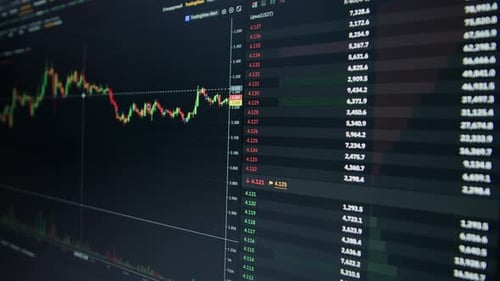
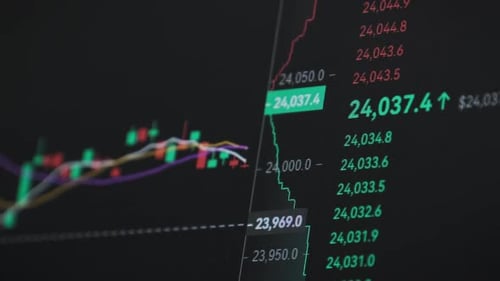
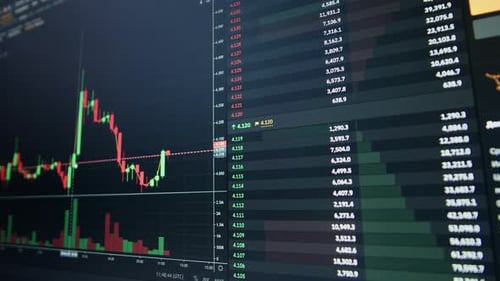
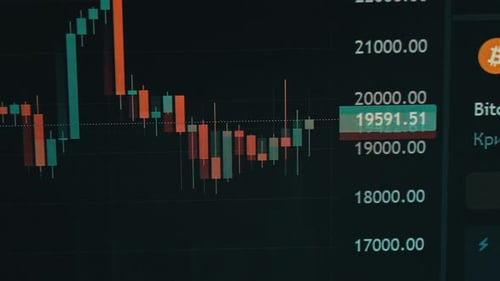
Financial Chart on Computer Screen with Candlestick Data
By magicstockOne great value subscription from $16.50/month
- Unlimited downloads of 27+ million creative assets
- AI Tools: video, image and more
- Lifetime commercial license
- Easy cancellation
Already have an account? Sign in
Attributes
- Length
- 0:08
- Resolution
- 4096 x 2160
- File Size
- 113 MB
- Frame Rate
- 25 fps
- Alpha Channel
- No
- Looped
- No
- Video Encoding
- H.264
- Orientation
- Horizontal
- Commercial License
- Further Information
Description
A financial chart is displayed on a computer monitor, showing candlestick-style price movements over time. The chart features both red and green candlesticks, indicating price decreases and increases, respectively. A thin red horizontal line crosses through the chart. Currency values and various icons are visible on the right side of the screen. This video could be useful for financial analysis, technology or business-related projects.


All
Music
Sound Effects