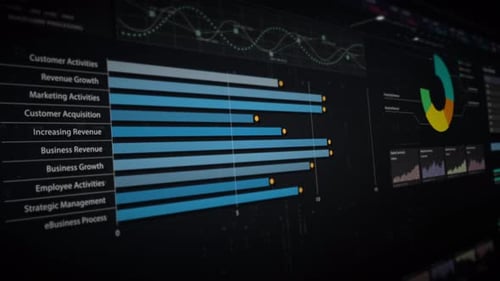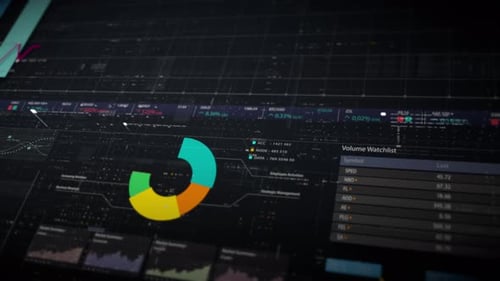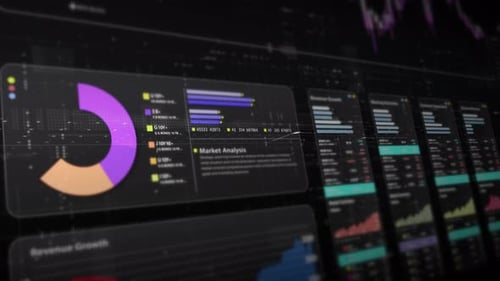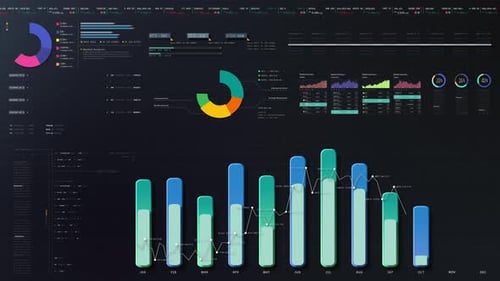
Animated Corporate Data Visualization Interface
By ColormotionsOne great value subscription from $16.50/month
- Unlimited downloads of 27+ million creative assets
- AI Tools: video, image and more
- Lifetime commercial license
- Easy cancellation
Already have an account? Sign in
Attributes
- Length
- 0:10
- Resolution
- 3840 x 2160
- File Size
- 808 MB
- Frame Rate
- 23.98 fps
- Alpha Channel
- No
- Looped
- No
- Video Encoding
- ProRes
- Orientation
- Horizontal
- Commercial License
- Further Information
Description
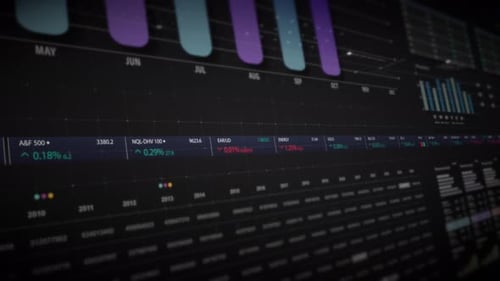
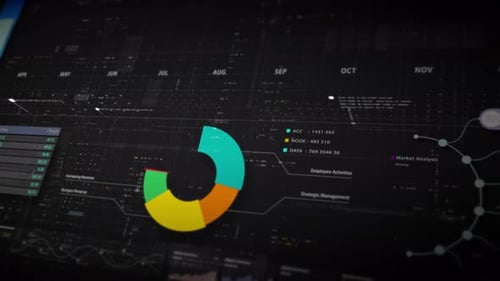
This dynamic animation showcases a sophisticated digital interface presenting corporate data visualization through an array of animated charts and graphs. A vibrant pie chart evolves, illustrating various data segments with smooth transitions, while a bar graph fluidly expands to represent monthly trends. Intricate lines and data points connect across a dark background, creating a high-tech and professional aesthetic. This motion graphic is ideal for enhancing business presentations, financial reports, technology demonstrations, or any content requiring a modern and engaging display of analytics and statistics.