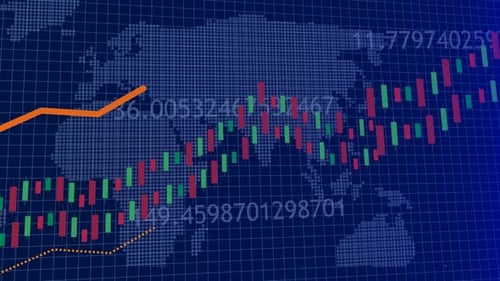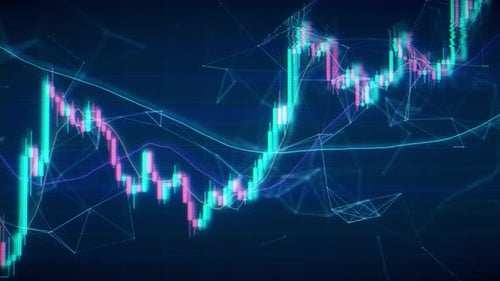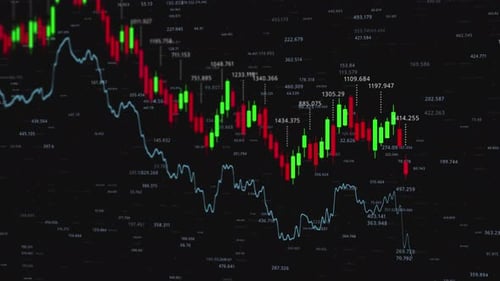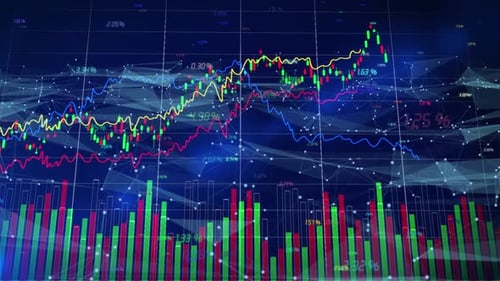
Candle Stick Graph Chart with Indicator Showing Bullish Point or Bearish Point
By Infi_StudioOne great value subscription from $16.50/month
- Unlimited downloads of 27+ million creative assets
- AI Tools: video, image and more
- Lifetime commercial license
- Easy cancellation
Already have an account? Sign in
Attributes
- Length
- 0:15
- Resolution
- 4096 x 2304
- File Size
- 58.5 MB
- Frame Rate
- 24 fps
- Alpha Channel
- No
- Looped
- No
- Video Encoding
- H.264
- Orientation
- Horizontal
- Commercial License
- Further Information
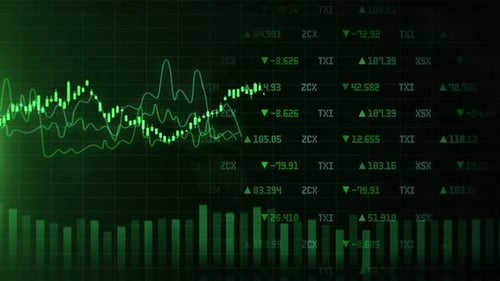
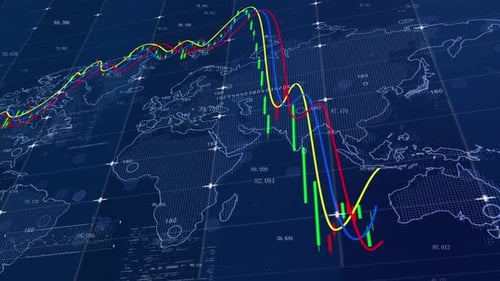
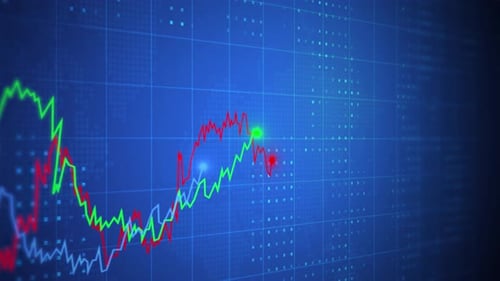
Description
This animated clip presents a dynamic visual representation of fluctuating data, ideal for corporate, financial, and technology-related projects. Multiple glowing lines, in green, red, and blue, move across a digital grid background, simulating market trends or statistical analysis. Bright points highlight key shifts along the lines as they dynamically intersect and evolve. The futuristic aesthetic, with its clean lines and subtle digital world map overlay, makes this visual effect perfect for illustrating concepts of global finance, technological progress, or complex data visualization in presentations, reports, or broadcast segments. It offers a sophisticated and engaging way to convey information flow and market activity.