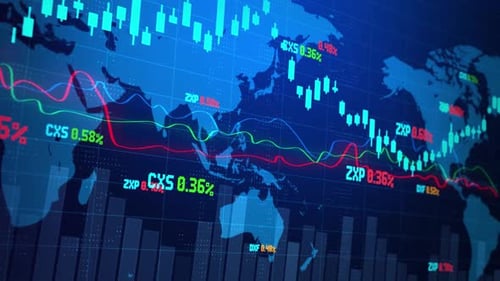
Animated Global World Map with Financial Data Graphs and Candlestick Chart
By 17635106560One great value subscription from $16.50/month
- Unlimited downloads of 27+ million creative assets
- AI Tools: video, image and more
- Lifetime commercial license
- Easy cancellation
- Length
- 0:08
- Resolution
- 1920 x 1080
- File Size
- 55 MB
- Frame Rate
- 25 fps
- Alpha Channel
- No
- Looped
- No
- Video Encoding
- H.264
- Orientation
- Horizontal
- Commercial License
- Further Information
Description
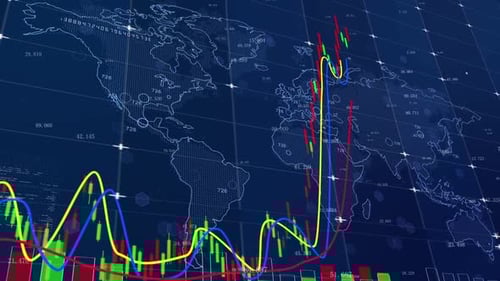
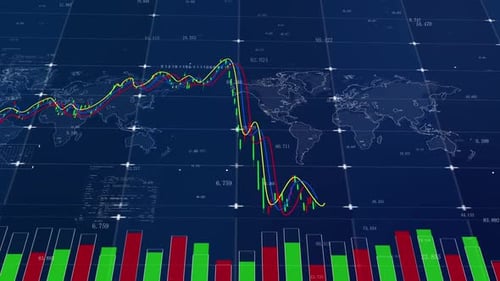
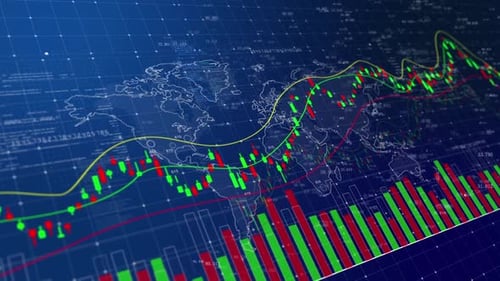
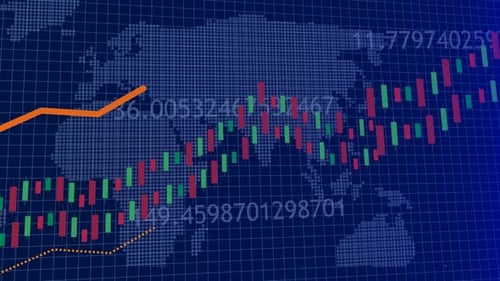
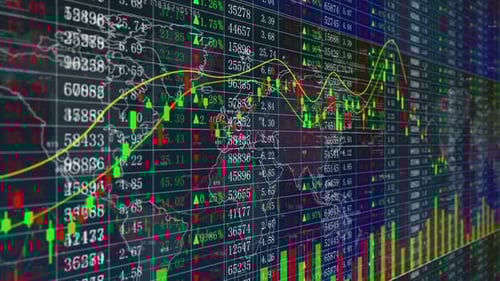
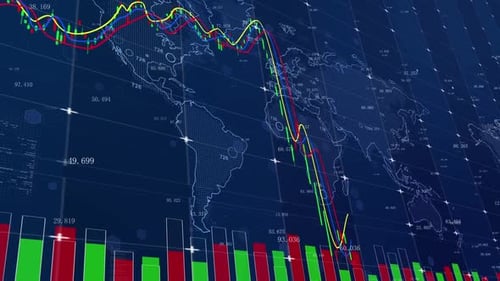
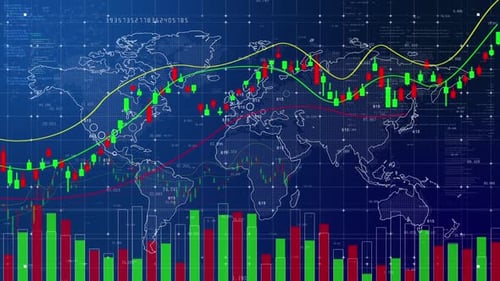
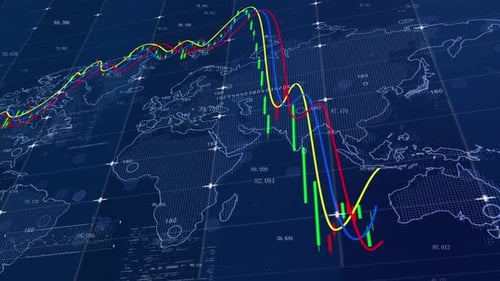
This dynamic animation presents a global perspective of financial data, featuring a wireframe world map overlaid with intricate line graphs and a candlestick chart. The vibrant red, yellow, and blue lines, alongside green and red candlesticks, fluctuate across the digital landscape, representing complex market trends and economic movements. A subtle grid pattern and numeric data points enhance the high-tech, futuristic aesthetic. This visual effect is ideal for corporate presentations, financial reports, business news segments, or any project requiring a sophisticated and engaging representation of global economic analysis and technological insights. Its clean design and fluid motion make it perfect for illustrating worldwide market fluctuations and data-driven narratives.