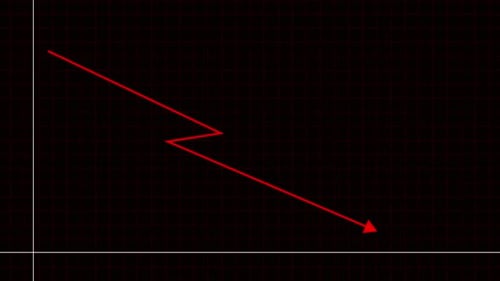
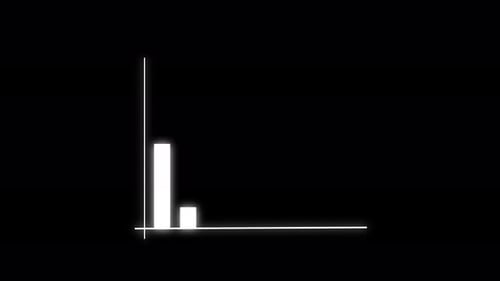
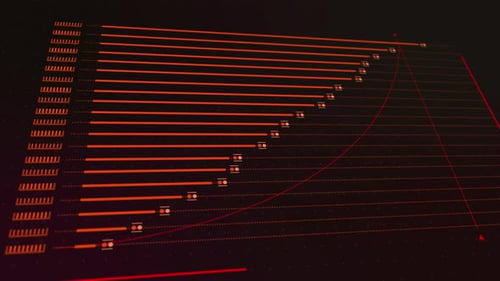
Futuristic Data Analysis With Decreasing Bar Graph And Virus Elements
By vectorfusionartOne great value subscription from $16.50/month
- Unlimited downloads of 27+ million creative assets
- AI Tools: video, image and more
- Lifetime commercial license
- Easy cancellation
Already have an account? Sign in
Attributes
- Length
- 0:10
- Resolution
- 4096 x 2160
- File Size
- 955 MB
- Frame Rate
- 24 fps
- Alpha Channel
- No
- Looped
- No
- Video Encoding
- ProRes
- Orientation
- Horizontal
- Commercial License
- Further Information
Description
This animated clip presents a dynamic data analysis visualization featuring a decreasing bar graph. The red and pink bars incrementally fall, indicating a downward trend, complemented by a dotted arrow guiding the eye along the decline. The background is a sophisticated digital interface with a grid overlay, abstract circular data visualizations, and subtle, glowing red virus-like structures, creating a high-tech and scientific atmosphere. This visual effect is ideal for enhancing presentations, scientific reports, medical broadcasts, or any content depicting financial downturns, research findings, or technological advancements. It provides a clear and engaging way to convey complex data trends.