Documentary Charts
By Parallel_universOne great value subscription from $16.50/month
- Unlimited downloads of 27+ million creative assets
- AI Tools: video, image and more
- Lifetime commercial license
- Easy cancellation
Already have an account? Sign in
Attributes
- Length
- 0:15
- Resolution
- 1920 x 1080
- File Size
- 20 MB
- Application Supported
- Premiere Pro
- Required Plugin
- None required
- Commercial License
- Further Information
Description
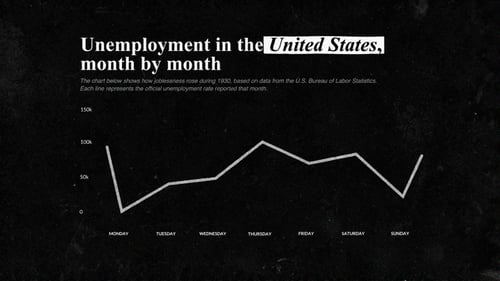
This professional video template offers a versatile collection of twelve data-driven scenes designed for documentary and corporate storytelling. The visual aesthetic features a tactile paper texture background, complemented by realistic tape elements and hand-drawn red annotations that guide the viewer's eye to significant findings. Included in this toolkit are various visualization types such as animated line graphs, vertical and horizontal bar charts, pie charts, scatter plots, and clean data tables. Each element is crafted with a focus on readability and modern design principles, utilizing a refined color palette and smooth motion graphics. The template is ideal for creators looking to present complex statistics, research findings, or financial reports with a sophisticated, editorial feel. Whether used for broadcast news, educational videos, or business presentations, these infographics provide a clear and engaging way to communicate numerical information while maintaining a consistent and high-quality aesthetic throughout the project.