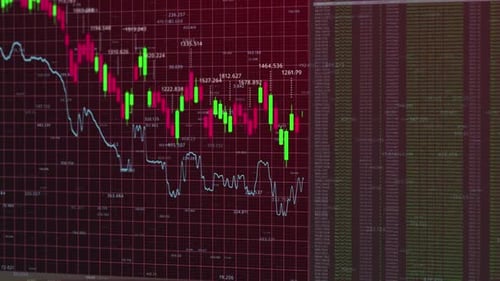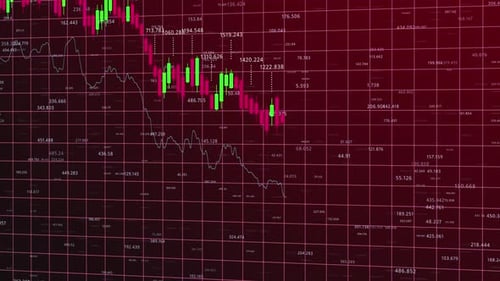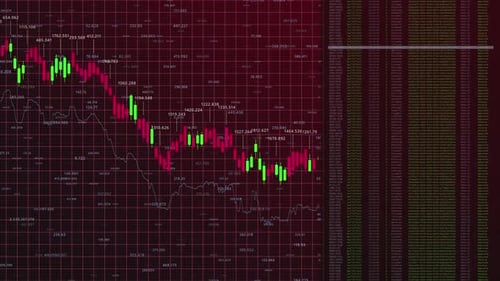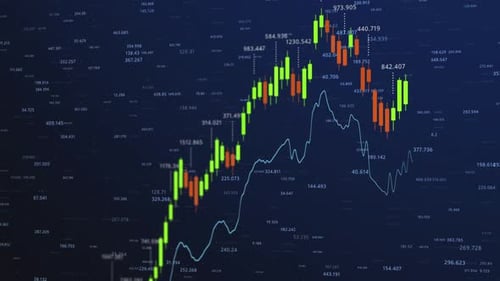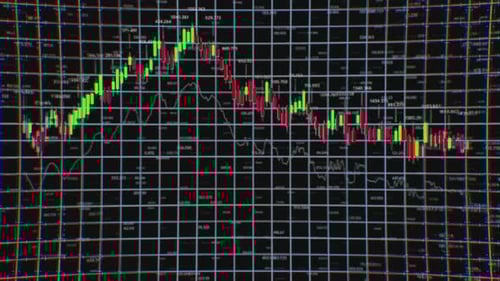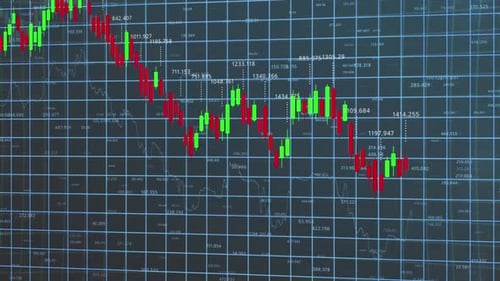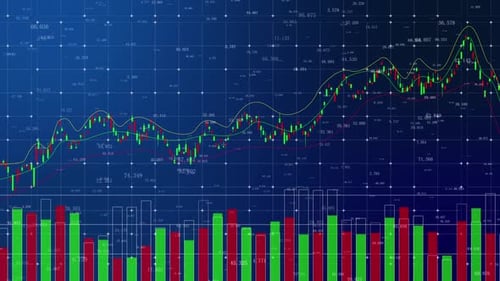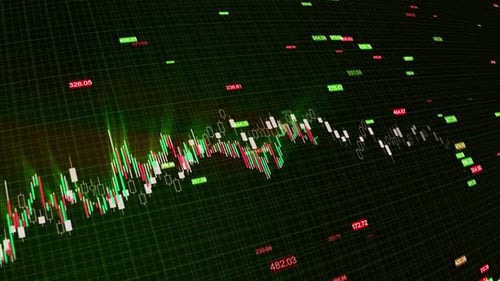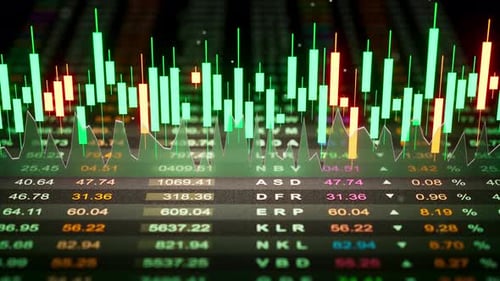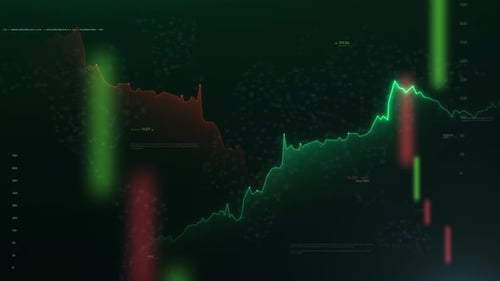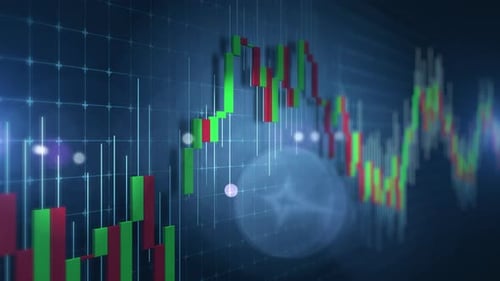
Dynamic Stock Market Analysis Visual Representation of Price Movements and Trading Trends on a
By kamionOne great value subscription from $16.50/month
- Unlimited downloads of 27+ million creative assets
- AI Tools: video, image and more
- Lifetime commercial license
- Easy cancellation
- Length
- 0:15
- Resolution
- 3840 x 2160
- File Size
- 43.6 MB
- Frame Rate
- 30 fps
- Alpha Channel
- No
- Looped
- No
- Video Encoding
- H.264
- Orientation
- Horizontal
- Commercial License
- Further Information
Description
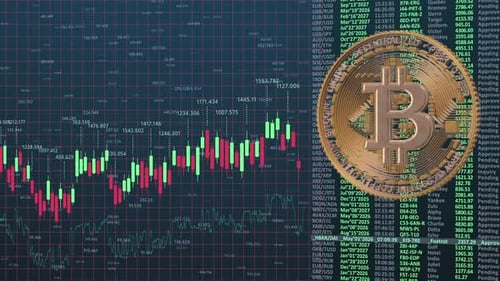
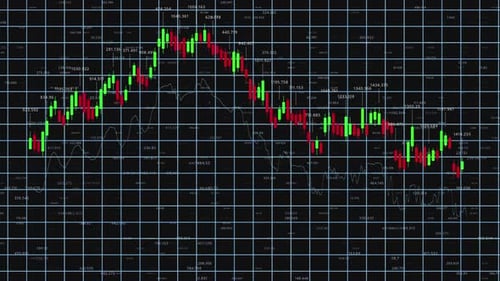
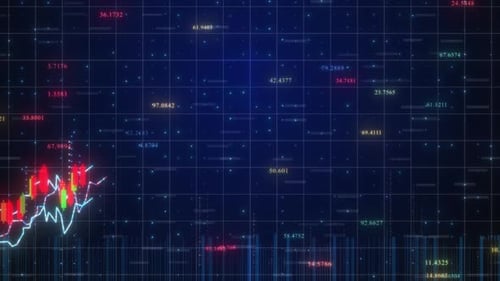
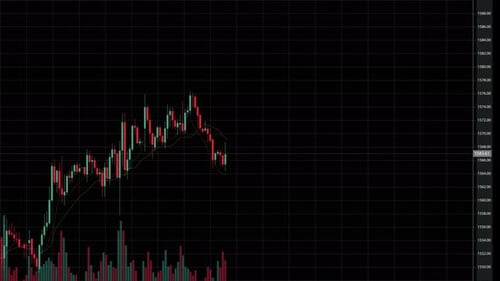
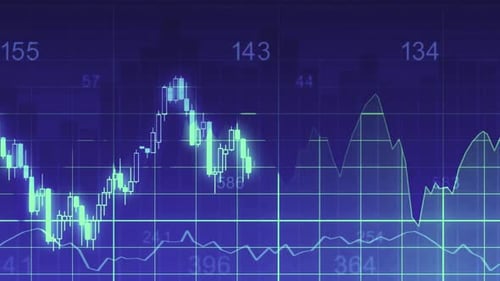
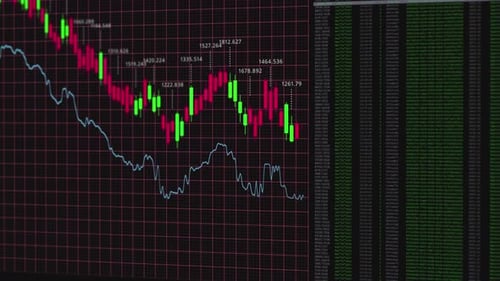
This animated clip presents a dynamic financial candlestick chart set against a dark grid background, continuously updating with red and green bars representing market fluctuations. A blue line graph overlays the candlesticks, displaying additional data points, while numerical values highlight specific peaks and troughs. On the right, a scrolling feed of green alphanumeric characters simulates real-time data streams. The camera subtly shifts its perspective, providing a comprehensive view of the evolving market data. This visual effect is ideal for enhancing presentations, reports, or news segments related to stock markets, cryptocurrency trading, business analytics, and economic trends, conveying a sense of live financial activity and digital data analysis.