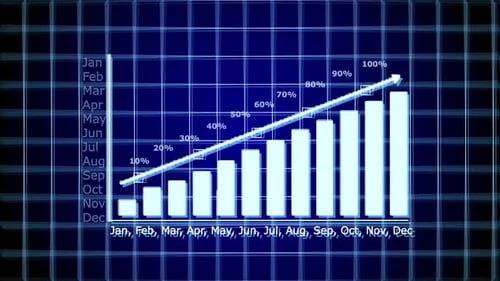
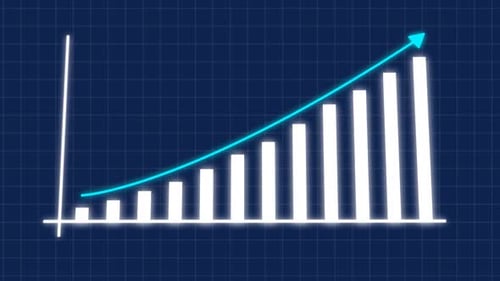
Graph with Rising Up Arrow and Bar Stats Financial Data and Diagrams
By Infi_StudioOne great value subscription from $16.50/month
- Unlimited downloads of 27+ million creative assets
- AI Tools: video, image and more
- Lifetime commercial license
- Easy cancellation
Already have an account? Sign in
Attributes
- Length
- 0:18
- Resolution
- 1920 x 1080
- File Size
- 65.3 MB
- Frame Rate
- 24 fps
- Alpha Channel
- No
- Looped
- No
- Video Encoding
- H.264
- Orientation
- Horizontal
- Commercial License
- Further Information
Description
This animated bar chart dynamically visualizes growing statistical data and trends. Bright cyan bars incrementally rise, accompanied by a white line graph that fluctuates and ultimately ascends, indicating positive growth. The deep blue background features a subtle grid and floating digital numbers, enhancing the high-tech, corporate aesthetic. This clean and modern data visualization is perfect for business presentations, financial reports, economic analyses, and technological explainers, effectively communicating progress and statistical insights.