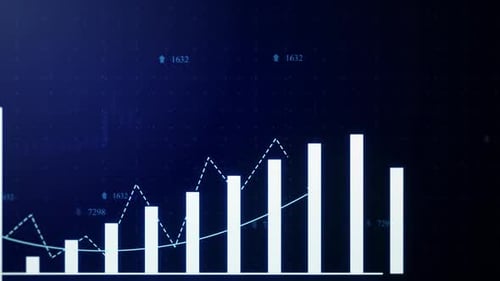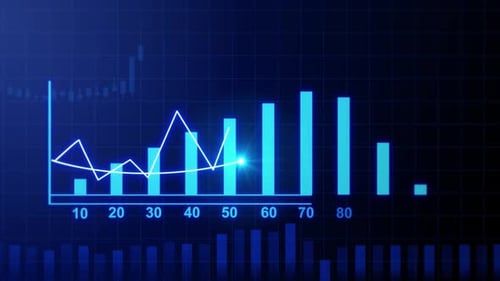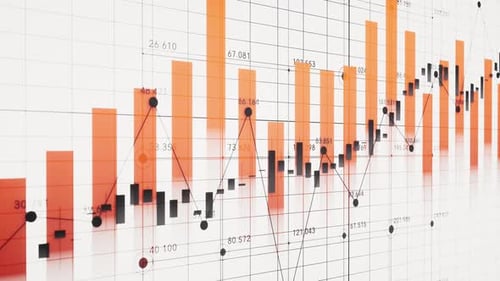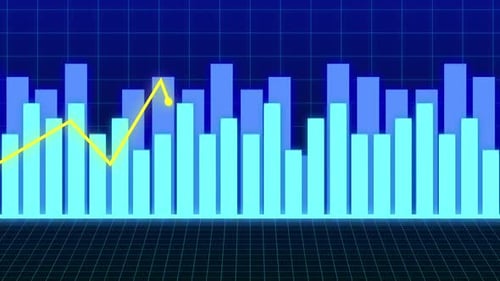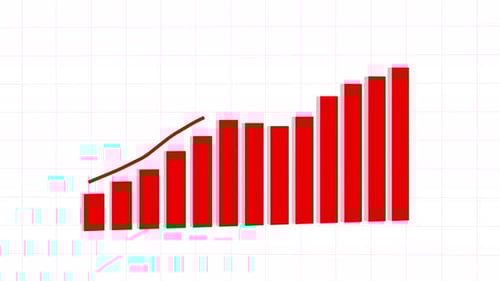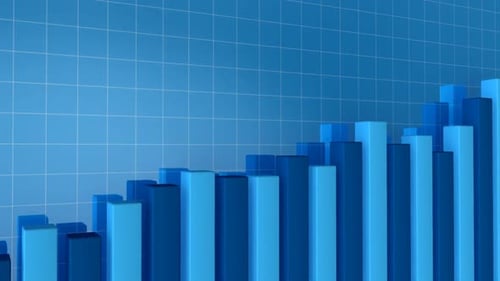
Animated Bar and Line Graph Data Visualization
By Infi_StudioOne great value subscription from $16.50/month
- Unlimited downloads of 27+ million creative assets
- AI Tools: video, image and more
- Lifetime commercial license
- Easy cancellation
- Length
- 0:15
- Resolution
- 1920 x 1080
- File Size
- 87.6 MB
- Frame Rate
- 30 fps
- Alpha Channel
- No
- Looped
- No
- Video Encoding
- H.264
- Orientation
- Horizontal
- Commercial License
- Further Information
Description
This animated clip presents a dynamic data visualization featuring a growing bar chart and a fluctuating line graph against a detailed grid background. The bars rise sequentially, illustrating quantitative data, while the line graph plots a corresponding trend, either increasing or decreasing. The clean, geometric aesthetic uses a warm orange color palette for the data elements, contrasted with a dark background featuring a subtle grid pattern and glowing points. This visual effect is perfect for corporate presentations, financial reports, business analytics, or educational content requiring clear and engaging statistical representation. It effectively conveys trends and figures, adding a professional and sophisticated touch to any project needing data explanation. The graphic provides a compelling way to show changes over time or comparisons between different categories.