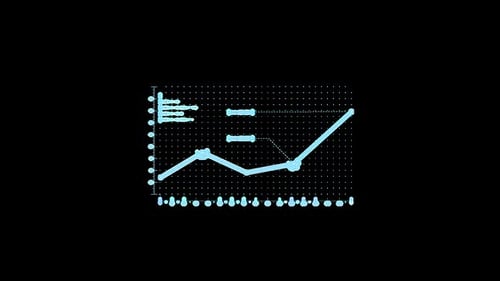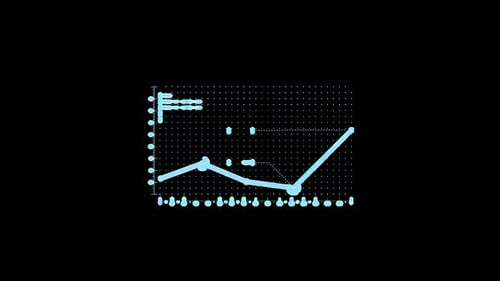
Interface Collection: Loop out of disruption of a graph on a dotted canvas displaying various parame
By FrameFictionOne great value subscription from $16.50/month
- Unlimited downloads of 27+ million creative assets
- AI Tools: video, image and more
- Lifetime commercial license
- Easy cancellation
Already have an account? Sign in
Attributes
- Length
- 0:02
- Resolution
- 1920 x 1080
- File Size
- 36.4 MB
- Frame Rate
- 29.97 fps
- Alpha Channel
- No
- Looped
- No
- Video Encoding
- ProRes
- Orientation
- Horizontal
- Commercial License
- Further Information
Description
This animated visual presents a dynamic line graph evolving over time. Clean, minimalist lines and data points smoothly trace a trend, illustrating growth or decline against a subtle grid background. The design features a clear grid, subtle dot patterns, and a vibrant accent color, creating a modern and professional aesthetic. Ideal for corporate presentations, financial reports, or scientific data visualizations, this graphic enhances content with a clear, engaging display of statistical information. It provides an effective way to convey complex data trends simply and elegantly, making it perfect for explainer videos, business analyses, or educational content.