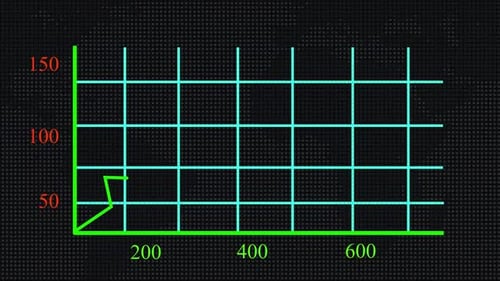
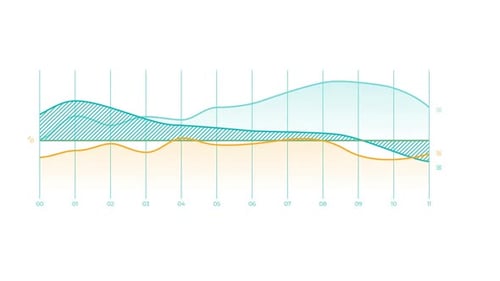
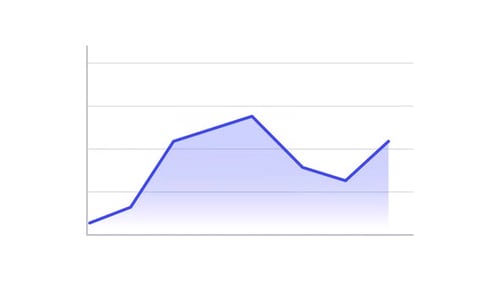
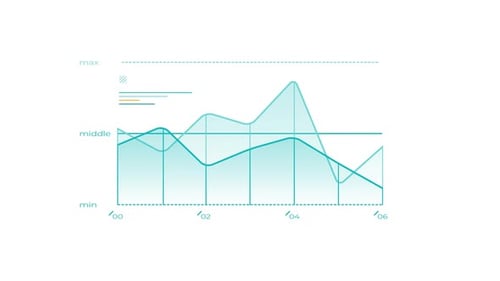
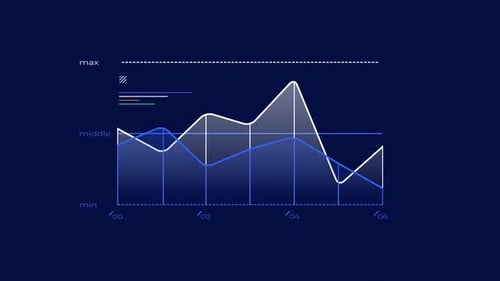
Minimalist Line Graph Data Visualization Animation
By ConceptCafeOne great value subscription from $16.50/month
- Unlimited downloads of 27+ million creative assets
- AI Tools: video, image and more
- Lifetime commercial license
- Easy cancellation
Already have an account? Sign in
Attributes
- Length
- 0:26
- Resolution
- 1920 x 1080
- File Size
- 72.1 MB
- Frame Rate
- 25 fps
- Alpha Channel
- No
- Looped
- No
- Video Encoding
- ProRes
- Orientation
- Horizontal
- Commercial License
- Further Information
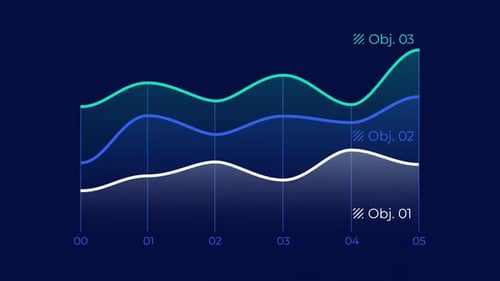
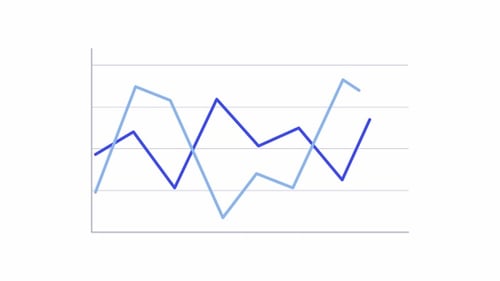
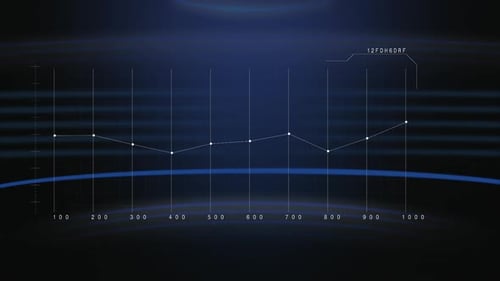
Description
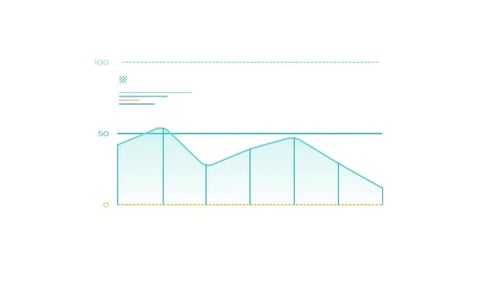
This animated clip features a minimalist line graph that visualizes data trends over time. Multiple data lines smoothly draw themselves across a grid, with a shaded area indicating a range or specific metric. Numerical labels appear progressively along the axes, enhancing readability and precision. The clean, monochromatic design emphasizes the information, making it suitable for a variety of analytical or educational contexts. This animation serves as a clear and professional visual aid for presentations, scientific reports, financial analyses, or any content requiring the depiction of evolving statistics.