Animated Line Graphs with Numerical Data and Dynamic Value Changes
By YuElaineOne great value subscription from $16.50/month
- Unlimited downloads of 27+ million creative assets
- AI Tools: video, image and more
- Lifetime commercial license
- Easy cancellation
- Length
- 0:20
- Resolution
- 1920 x 1080
- File Size
- 426 MB
- Frame Rate
- 30 fps
- Alpha Channel
- No
- Looped
- Yes
- Video Encoding
- H.264
- Orientation
- Horizontal
- Commercial License
- Further Information
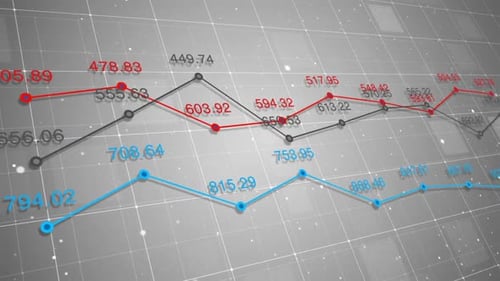
Description
This animated background features multiple line graphs displaying fluctuating numerical data points over a clean, subtle grid. Three distinct lines, rendered in red, black, and blue, dynamically trace their paths across the screen, with associated numerical values updating continuously alongside each data point. Small white particles gently float in the background, adding subtle depth and movement to the sophisticated data visualization. The camera subtly pans and shifts perspective, enhancing the dynamic feel of the trends presented. This visual effect is ideal for corporate presentations, financial analyses, technological explainers, and any project that requires a professional and engaging data-driven backdrop, illustrating trends and statistics with clarity and modern style.