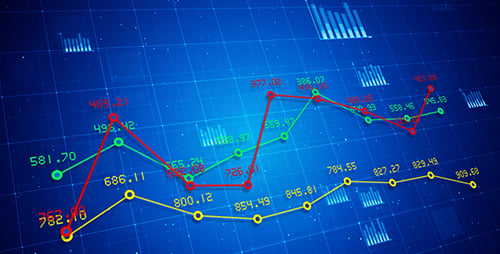
Modern Digital Line Graph for Data Visualization Background
By YuElaineOne great value subscription from $16.50/month
- Unlimited downloads of 27+ million creative assets
- AI Tools: video, image and more
- Lifetime commercial license
- Easy cancellation
Already have an account? Sign in
Attributes
- Length
- 0:30
- Resolution
- 1920 x 1080
- File Size
- 220 MB
- Frame Rate
- 30 fps
- Alpha Channel
- No
- Looped
- Yes
- Video Encoding
- H.264
- Orientation
- Horizontal
- Commercial License
- Further Information
Description
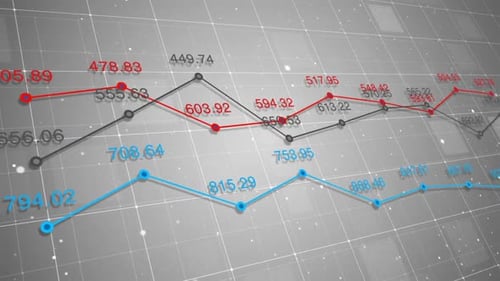
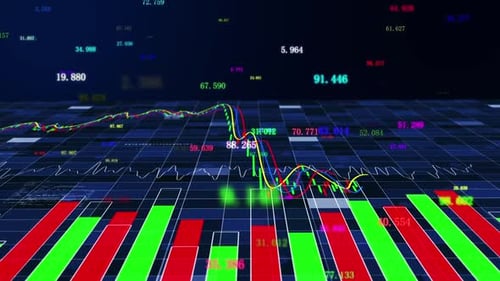
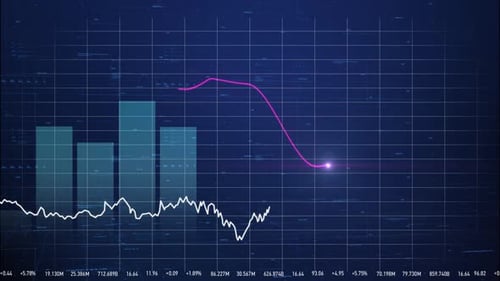
This animated clip presents a sophisticated digital line graph, featuring three distinct data sets represented by blue, red, and green lines. Numerical values dynamically fluctuate at each data point, illustrating trends of growth and decline against a dark blue grid background with subtle, floating plus signs. The sleek and modern aesthetic is ideal for enhancing corporate presentations, financial market analysis, business reports, and technology-focused content. This visual effect effectively conveys complex data and market fluctuations, providing a professional and dynamic background for any project requiring an analytical or economic theme.
Audio used in this item