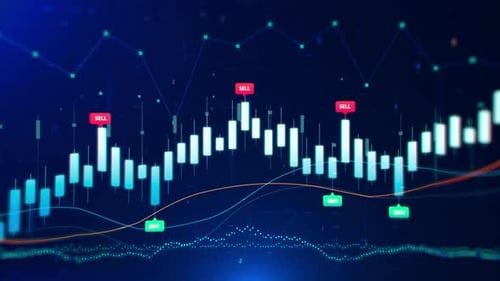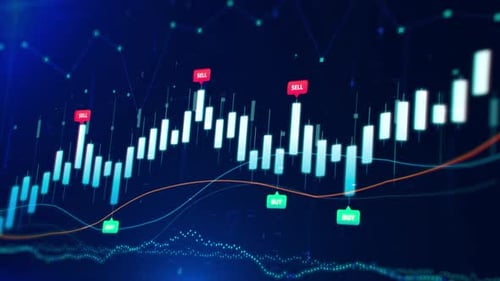
Futuristic Digital Stock Market Candlestick Chart Analysis
By EA09studioOne great value subscription from $16.50/month
- Unlimited downloads of 27+ million creative assets
- AI Tools: video, image and more
- Lifetime commercial license
- Easy cancellation
- Length
- 0:07
- Resolution
- 3840 x 2160
- File Size
- 8.6 MB
- Frame Rate
- 25 fps
- Alpha Channel
- No
- Looped
- Yes
- Video Encoding
- H.264
- Orientation
- Horizontal
- Commercial License
- Further Information
Description
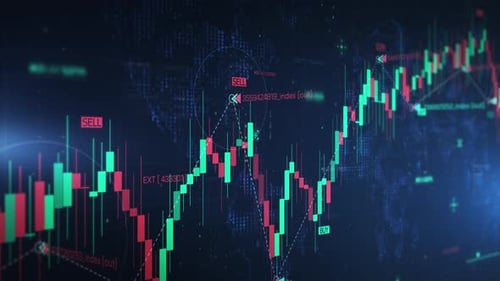
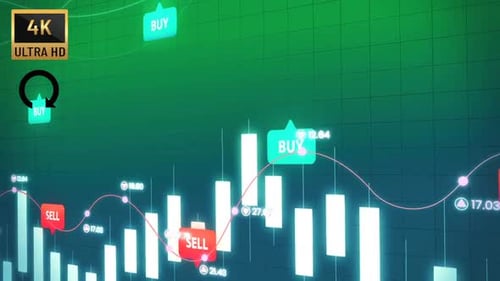
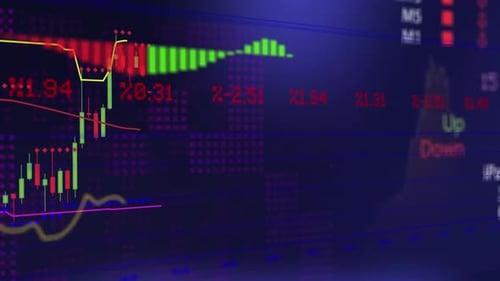
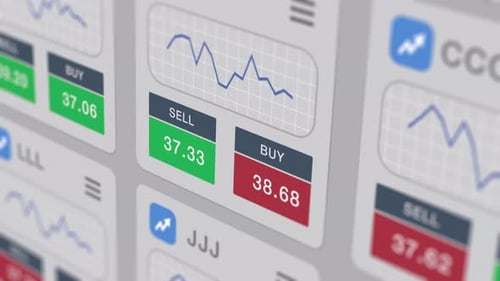
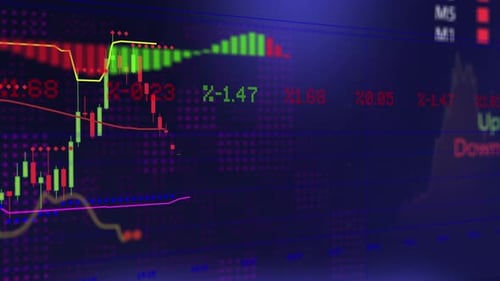
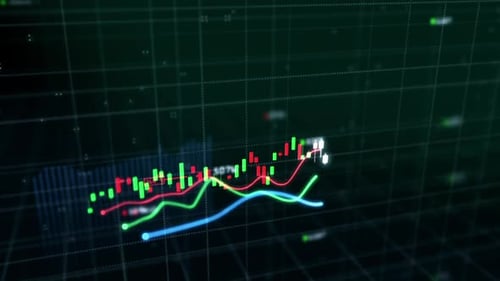
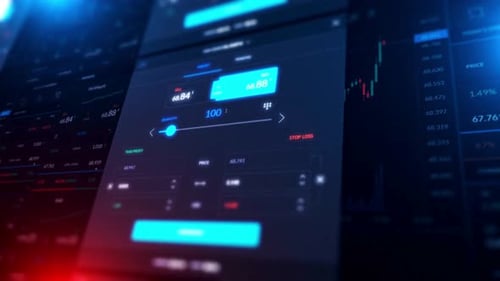
A dynamic, futuristic animation displays a detailed financial candlestick chart with real-time data fluctuations. Line graphs, floating data points, and "BUY" and "SELL" indicators move across a dark blue background. The chart elements illuminate and shift, visualizing market trends and trading signals. Background elements include abstract numbers and letters. The aesthetic is sleek, high-tech, and professional, utilizing a cool blue and green color palette with contrasting red for "SELL" signals. The smooth motion and glowing elements create a sense of continuous data flow and sophisticated analysis. This animated clip is ideal for enhancing presentations, financial reports, business explainers, or technology-focused content requiring a visual representation of market analysis, stock trading, or economic data. It adds a professional and dynamic visual layer to illustrate complex financial information effectively.