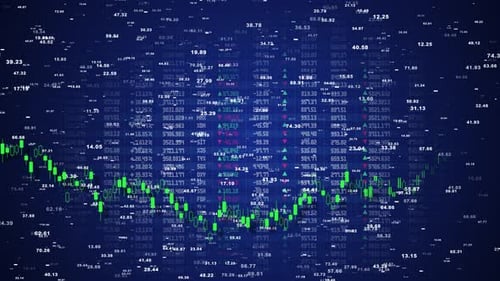
Dynamic Candlestick Stock Market Chart with Buy Sell Indicators
By EA09studioOne great value subscription from $16.50/month
- Unlimited downloads of 27+ million creative assets
- AI Tools: video, image and more
- Lifetime commercial license
- Easy cancellation
Already have an account? Sign in
Attributes
- Length
- 0:07
- Resolution
- 3840 x 2160
- File Size
- 9.01 MB
- Frame Rate
- 25 fps
- Alpha Channel
- No
- Looped
- Yes
- Video Encoding
- H.264
- Orientation
- Horizontal
- Commercial License
- Further Information
Description
This animated digital financial graph visually represents stock market activity with dynamic candlestick bars and fluctuating line charts. Key 'BUY' and 'SELL' indicators appear and vanish, highlighting potential trading points. The background features subtle numerical data flow and a grid pattern, enhancing the sense of complex data analysis. Designed with a modern, sleek aesthetic and vibrant blue and green tones, this visual asset is ideal for corporate presentations, economic reports, financial news segments, and business-focused video projects requiring a professional and engaging data visualization to explain market trends and investment strategies.