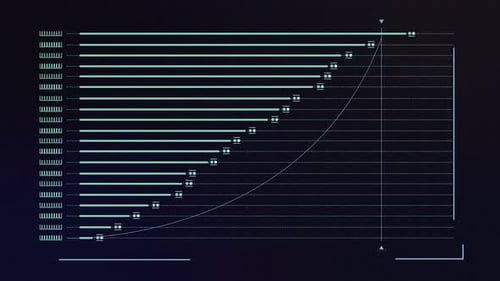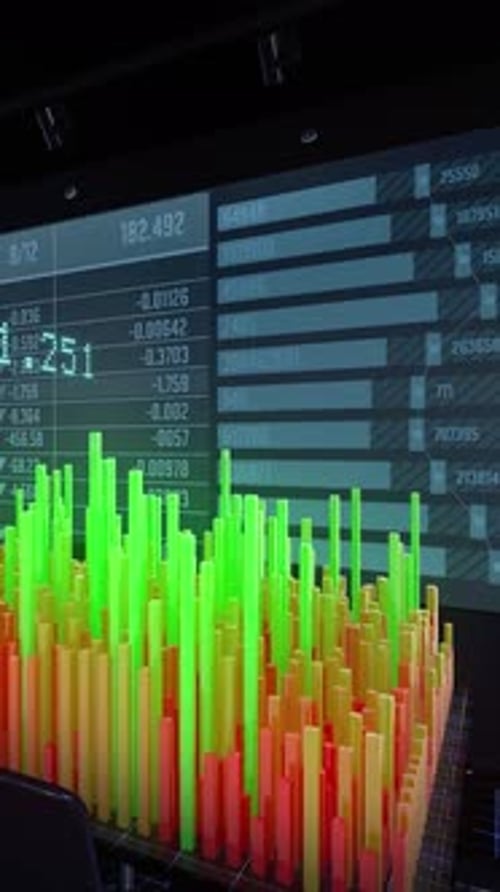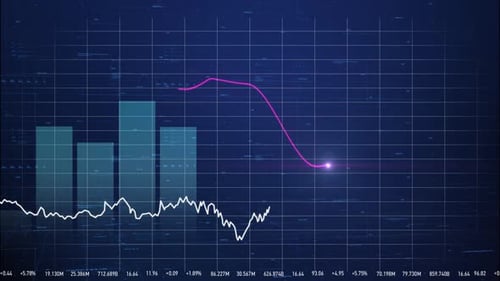
Animated Bar Chart with Line Graph Data Display
By keleshOne great value subscription from $16.50/month
- Unlimited downloads of 27+ million creative assets
- AI Tools: video, image and more
- Lifetime commercial license
- Easy cancellation
Already have an account? Sign in
Attributes
- Length
- 0:10
- Resolution
- 3840 x 2160
- File Size
- 139 MB
- Frame Rate
- 25 fps
- Alpha Channel
- No
- Looped
- No
- Video Encoding
- H.264
- Orientation
- Horizontal
- Commercial License
- Further Information
Description
This dynamic animated data visualization features a modern digital interface displaying a bar chart and an overlaying line graph. Horizontal bars extend progressively, each indicating a value, while a corresponding line graph traces an upward trajectory, signifying growth or trend. Small, glowing points move along the data lines, adding to the interactive feel. The sleek, grid-lined dark background enhances the technical and analytical aesthetic, making this animation ideal for illustrating business growth, financial statistics, technological advancements, or any data-driven narrative. It provides a clean and professional visual element to presentations, reports, and digital dashboards.