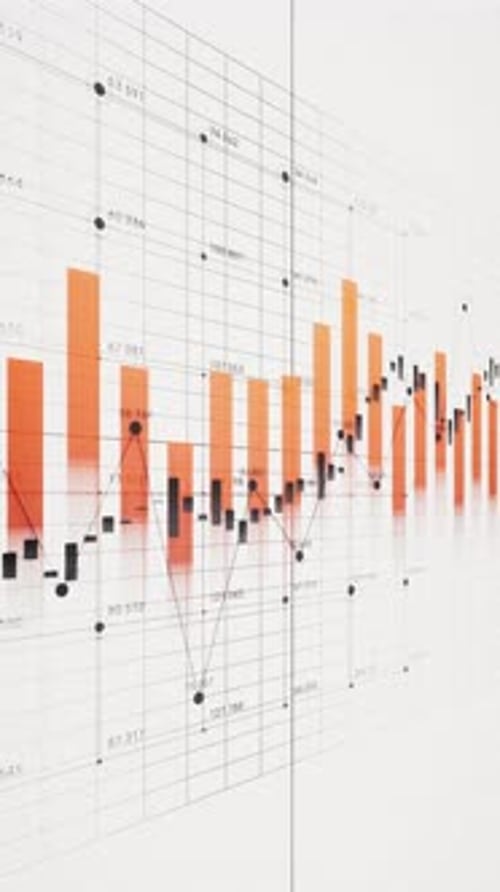
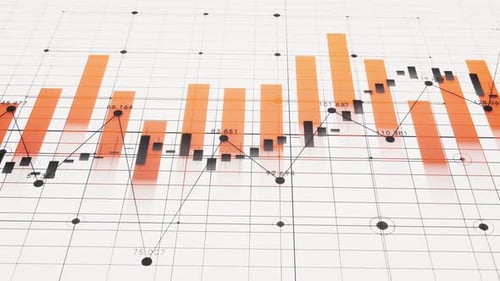
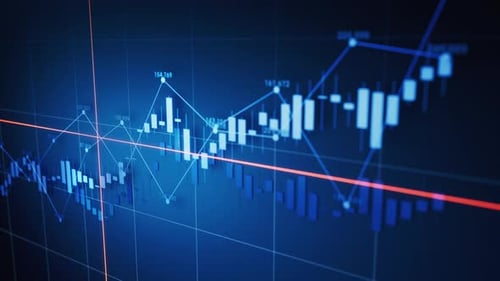
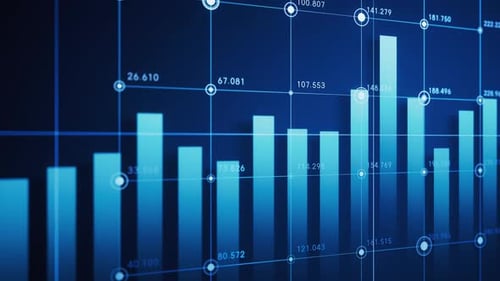
Animated Financial Growth Bar Graph with Line Chart Data Statistics
By vinkfanOne great value subscription from $16.50/month
- Unlimited downloads of 27+ million creative assets
- AI Tools: video, image and more
- Lifetime commercial license
- Easy cancellation
Already have an account? Sign in
Attributes
- Length
- 0:10
- Resolution
- 3840 x 2160
- File Size
- 900 MB
- Frame Rate
- 30 fps
- Alpha Channel
- No
- Looped
- No
- Video Encoding
- ProRes
- Orientation
- Horizontal
- Commercial License
- Further Information
Description
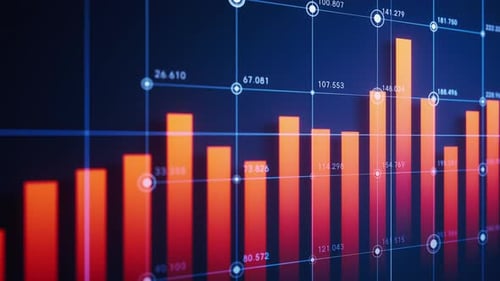
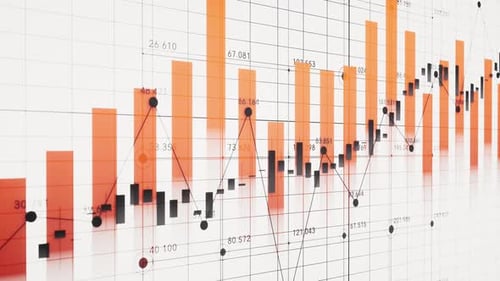
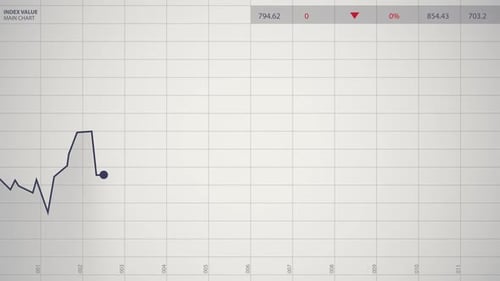
This animated visual effect presents dynamic financial data through a series of rising orange bar graphs and fluctuating black line charts. Numerical values constantly update, illustrating growth and change over time on a clean white grid background. Reflections underneath the data visualization add a sense of depth and professionalism. This contemporary animation is ideal for corporate presentations, financial reports, market analysis, or any project requiring a clear and engaging representation of statistical information and business trends.


.jpg?w=500&cf_fit=cover&q=85&format=auto&s=4c0ea3cd78e24f008f451592c1bcbb0bf046854ccc6306f713b90a8e0d599aec)