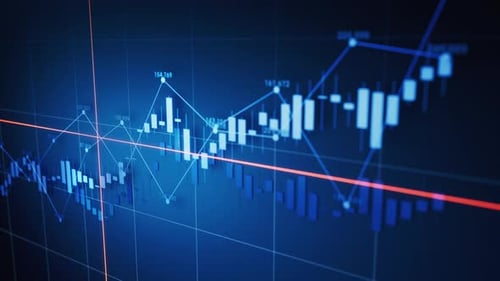
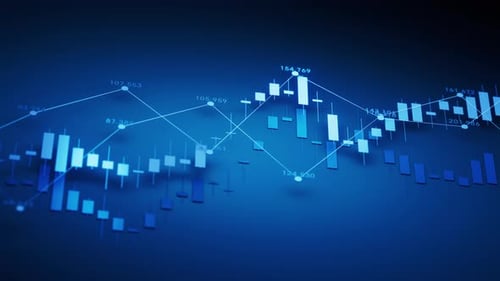
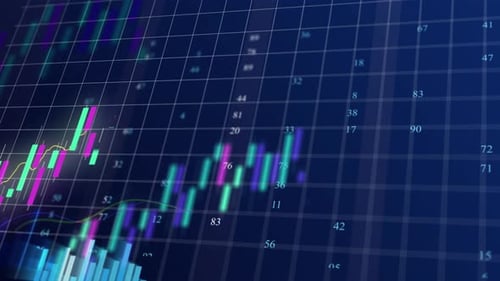
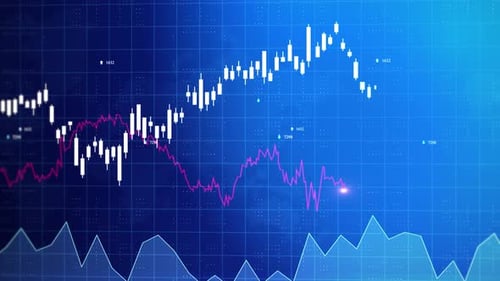
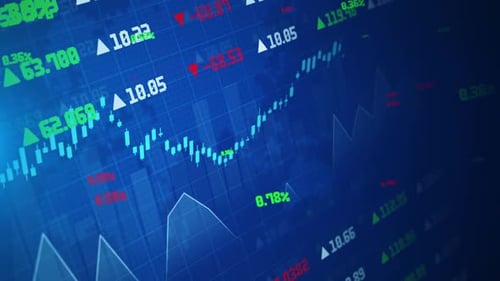
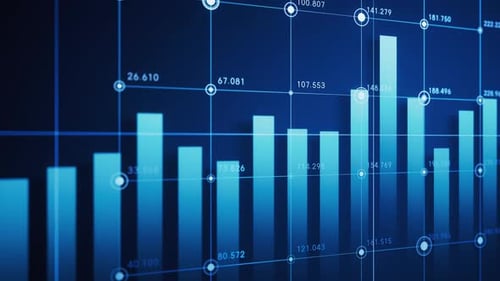
Animated Blue Stock Market Bar and Line Graph Data
By vinkfanOne great value subscription from $16.50/month
- Unlimited downloads of 27+ million creative assets
- AI Tools: video, image and more
- Lifetime commercial license
- Easy cancellation
- Length
- 0:10
- Resolution
- 3840 x 2160
- File Size
- 826 MB
- Frame Rate
- 30 fps
- Alpha Channel
- No
- Looped
- No
- Video Encoding
- ProRes
- Orientation
- Horizontal
- Commercial License
- Further Information
Description
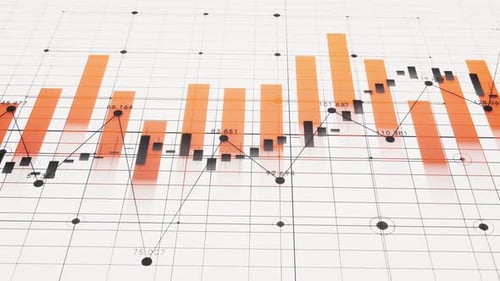
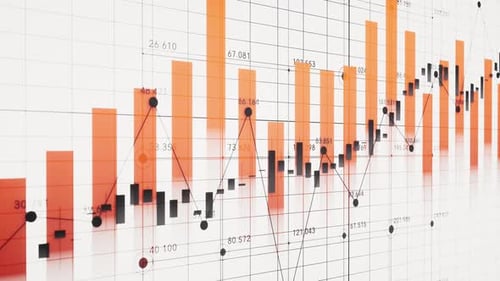
This visually compelling animated clip offers a sophisticated digital representation of financial market dynamics, featuring a continuous flow of blue bar charts, intricate line graphs, and detailed candlestick charts. These data visualizations move dynamically across a subtle grid, with bars illustrating growth and decline, lines tracing fluctuating trends, and numerical values constantly updating to reflect complex data shifts. The cool blue color palette, combined with a modern, crisp aesthetic, creates a professional and high-tech feel. This animation is perfectly suited for corporate videos, financial news segments, business presentations, market analysis reports, or any project that aims to convey concepts of economic performance, investment strategies, or stock trading with clarity and engaging motion. It provides a sleek backdrop for explaining complex financial concepts or showcasing analytical insights in a visually impactful manner.